Humans tend to guess things as per historical knowledge. Some people do it using assumptions while others do it in a blindfolded way 😐. However, any assumption requires a shred of concrete evidence and to do so we need some benchmark or a condition to assess our test.
Notably, the assumption is our hypothesis and the test we conducted to evaluate our assumptions is known as Statistical Hypothesis Testing, which uses small data and statistics to provide inference whether to accept or reject our assumptions.
“Hypothesis testing is a form of inferential statistics that use data points and allows us to draw conclusions about an entire population based on the sample data.”
Therefore, the process of checking Hypotheses comprises forming questions about data based on collected information and testing them by statistical methods.
There are two possible outcomes: if the result confirms the hypothesis, then you’ve made a measurement. If the result is contrary to the hypothesis, then you’ve made a discovery — Enrico Fermi
For example, suppose a doctor believes that a new drug can reduce blood pressure in obese patients. To test this, he may measure the blood pressure of 40 patients before and after using the new drug for one month.
He then performs a hypothesis test using the following hypotheses:
H0: μafter = μbefore (the mean blood pressure is the same before and after using the drug)
HA: μafter < μbefore (the mean blood pressure is less after using the drug)
Hypothesis Testing
Hypothesis testing is a statistical analysis that uses sample data to assess two mutually exclusive theories(null hypothesis(H0) and the alternative hypothesis(HA)) about the properties of a population.
Null Hypothesis
The null hypothesis is one of two mutually exclusive theories about the properties of the population in hypothesis testing. Typically, the null hypothesis states that there is no effect (i.e., the effect size equals zero).
The null is often signified by H0.
We can think of the null as the default theory that requires sufficiently strong evidence to reject it.
Alternative Hypothesis
The alternative hypothesis, on the other hand, states that a population parameter does not equal the null hypothesis value. In other words, there is a non-zero effect.

Five Steps in Hypothesis Testing
- Specify the Null Hypothesis
- Specify the Alternative Hypothesis
- Set the Significance Level (ɑ)
- Calculate the T-test Statistic and Corresponding P-Value
- Drawing a Conclusion
What is a T-test?
The t-test tells us how significant the differences between groups are. In other words, it lets us know if those differences (measured in means) could have happened by chance.
The T-Score
The t-score is a ratio between the difference between two groups and the difference within the groups.
- The larger the t-score, the more difference there is between groups.
- The smaller the t-score, the more similarity there is between groups.
A t-score of 3 means that the groups are three times as different from each other as they are within each other.
P-value
A p-value is a probability that the results from our sample data occurred by chance. P-values are from 0% to 100%.
Low p-values are good which indicate our data did not occur by chance.
For example, a p-value of .01 means there is only a 1% probability that the results from an experiment happened by chance. In most cases, a p-value of 0.05 (5%) is accepted to mean the data is valid.
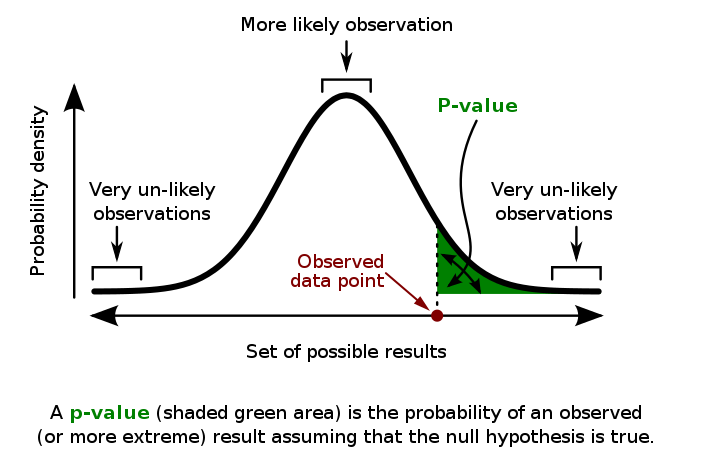
The p-value is probabilistic. This means that when we interpret the result of a statistical test, we do not know what is true or false, only what is likely.
P-value vs Probability
In probability, this would be written as follows:
Pr(hypothesis | data)
This is incorrect.
Instead, the p-value can be thought of as the probability of the data given the pre-specified assumption embedded in the statistical test.
Again, using probability notation, this would be written as:
Pr(data | hypothesis)
It allows us to reason about whether or not the data fit the hypothesis. Not the other way around.
The p-value is a measure of how likely the data sample would be observed if the null hypothesis were true.
Significance Level (Alpha)
The significance level, also known as alpha or α, is a standard that researchers set before the study. It specifies how strongly the sample evidence must contradict the null hypothesis before we can reject the null for the entire population. This standard is defined by the probability of rejecting a true null hypothesis.
For instance, a significance level of 0.05 signifies a 5% risk of deciding that an effect exists when it does not exist.

Source: Wikipedia
Types of Errors in Hypothesis Testing
Statistical hypothesis tests are not 100% accurate because they use a random sample to conclude entire populations. There are two types of errors related to drawing an incorrect conclusion.
False positives
This error occurs when a researcher incorrectly rejects a true null hypothesis. We can reduce our risk of committing a type I error by using a lower value for p.
For example, a p-value of 0.01 would mean there is a 1% chance of committing a Type I error. This means that we will wrongfully assume that our hypothesis testing has worked even though it hasn’t. The Type I error rate is also known as alpha (α).
False negatives
Rejecting an alternate hypothesis when it is true.
Example – Diagnosis of cancer infected patients as healthy or testing pregnant women as not pregnant.
This error occurs when a researcher fails to reject a false null hypothesis. The type II error rate is also known as beta (β).

Conclusion
To sum up, Hypothesis testing is an essential procedure in statistics. It evaluates the statements about a population to determine which statement is best supported by the data sample.
Regardless of the surety about the outcome, we should assess our assumptions on some criterion level and the best way to do this is using a statistical test.
Reference
https://statisticsbyjim.com
https://www.analyticsvidhya.com/blog/2021/07/hypothesis-testing-made-easy-for-the-data-science-beginners/