A brief history of Datadog
Datadog is an infrastructure monitoring service that helps users or developers(especially DevOps) monitor the different services. It helps in monitoring the health of the infrastructure by providing the monitoring on the basis of the location, application, or service. Monitoring can also be done on the server levels also.
Datadog was founded by Alexis Le-Quoc and Oliver Pomel in 2010. The main AIM behind creating the Datadog was to bridge the gap between the developer and the system administration team.
In the early phase of Datadog, it was created as a cloud infrastructure monitoring service with the capabilities of visualization, dashboards, and alarms and alerts system. With the rapid growth in the cloud infrastructure services and the capabilities, Datadog expanded its services by providing integration with the different service providers such as AWS, GCP, and Azure.
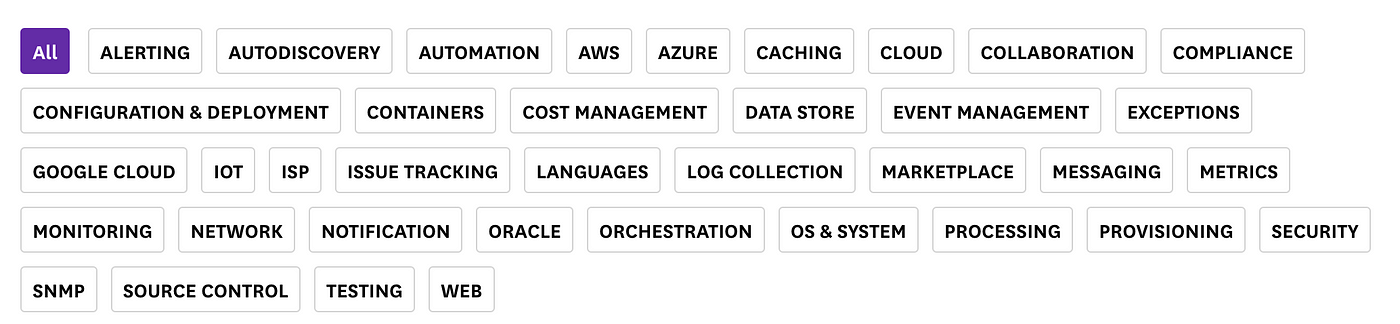
On the present day(17 June 2022) the integration that is supported are-
Tour of the Datadog Dashboard
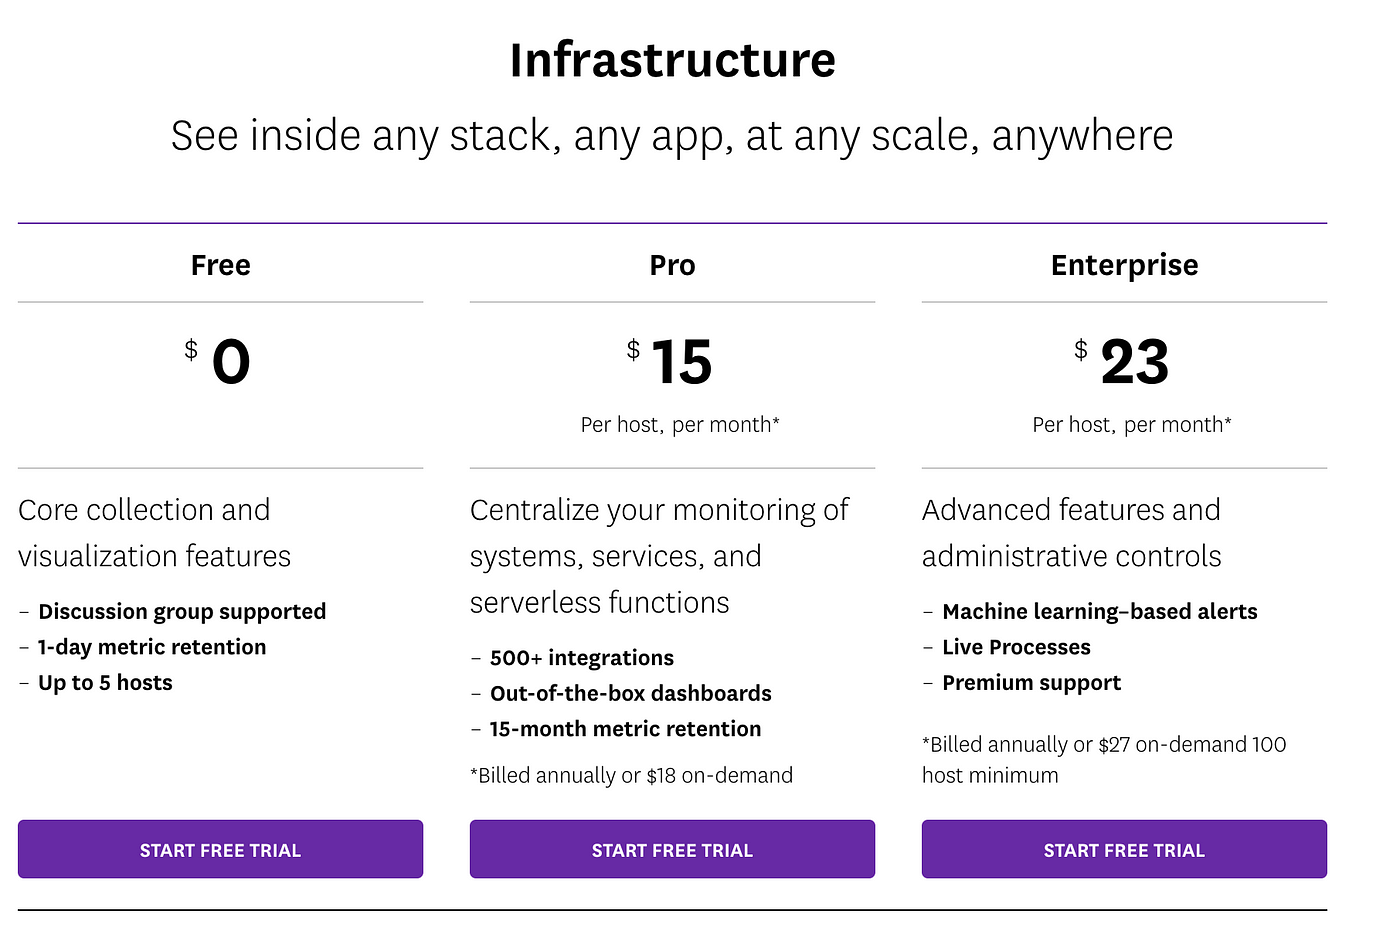
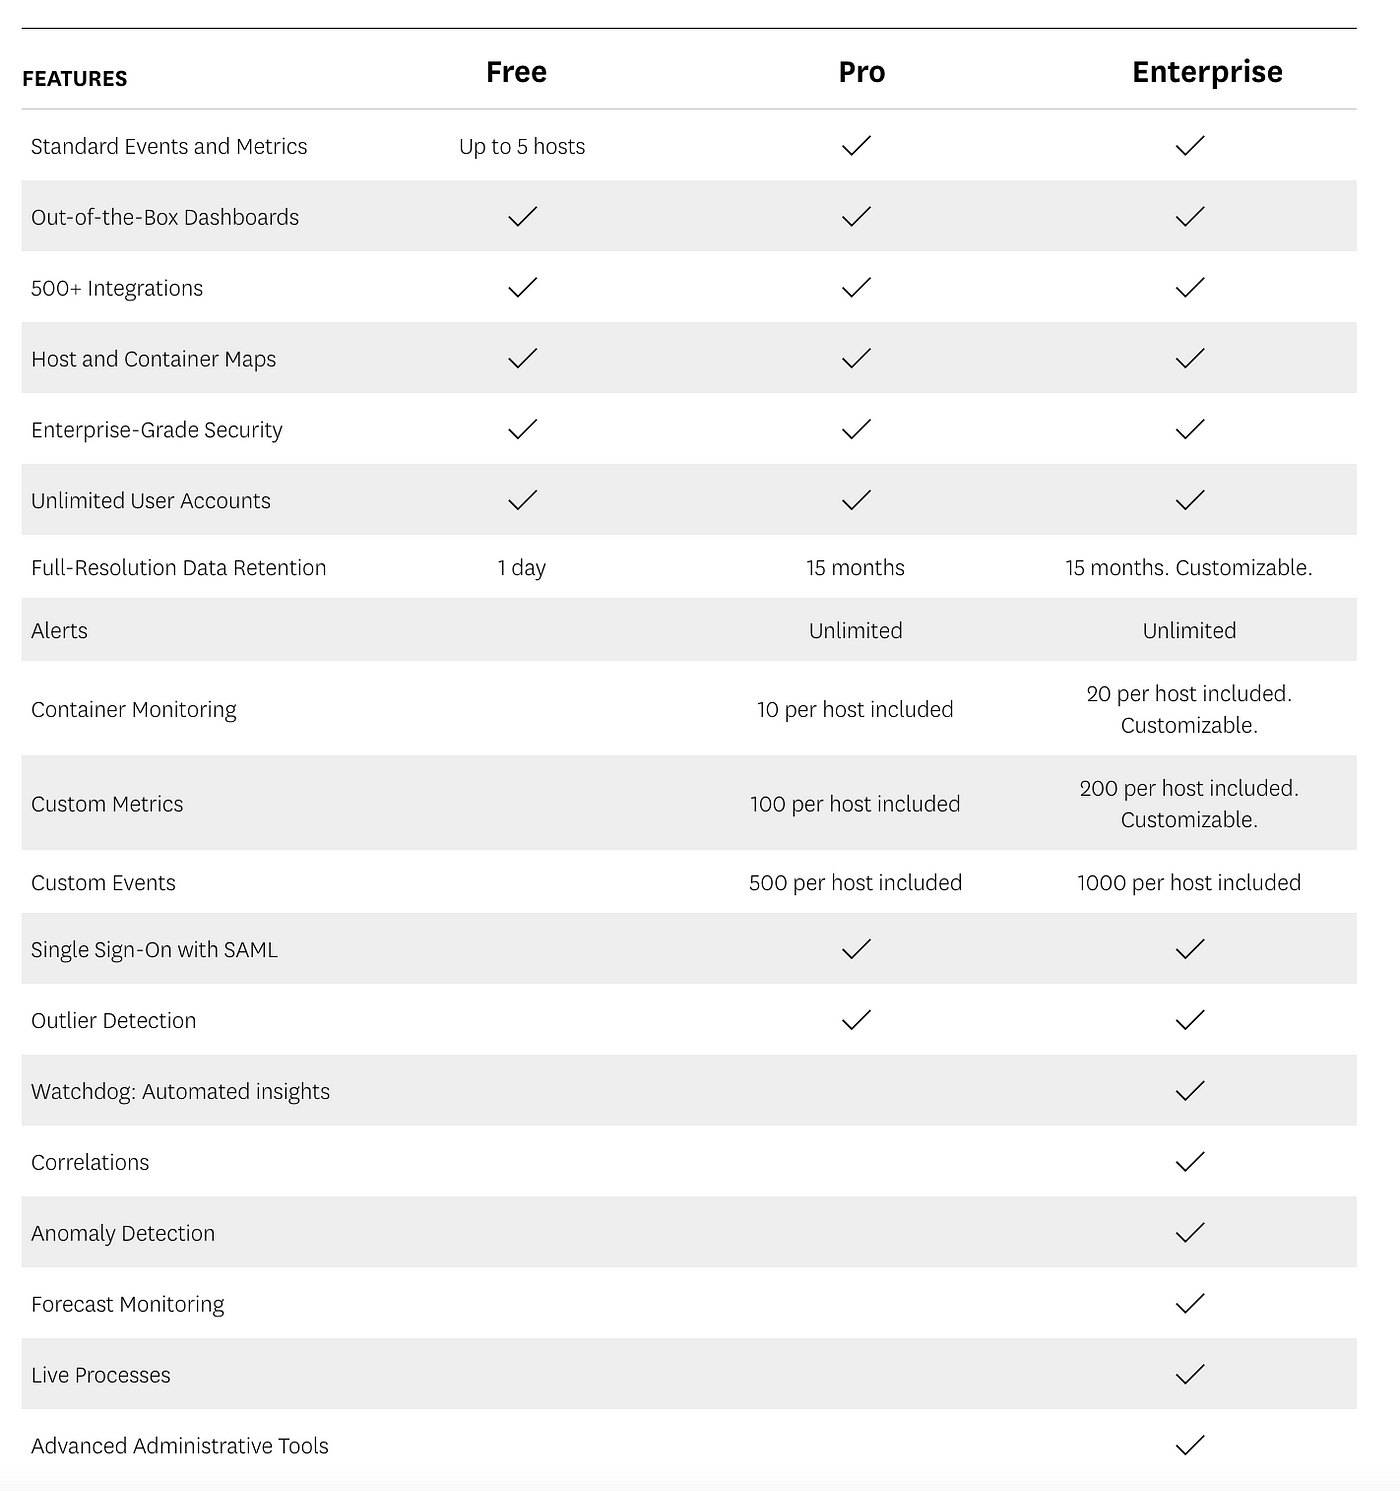
Pricing of the Dashboard
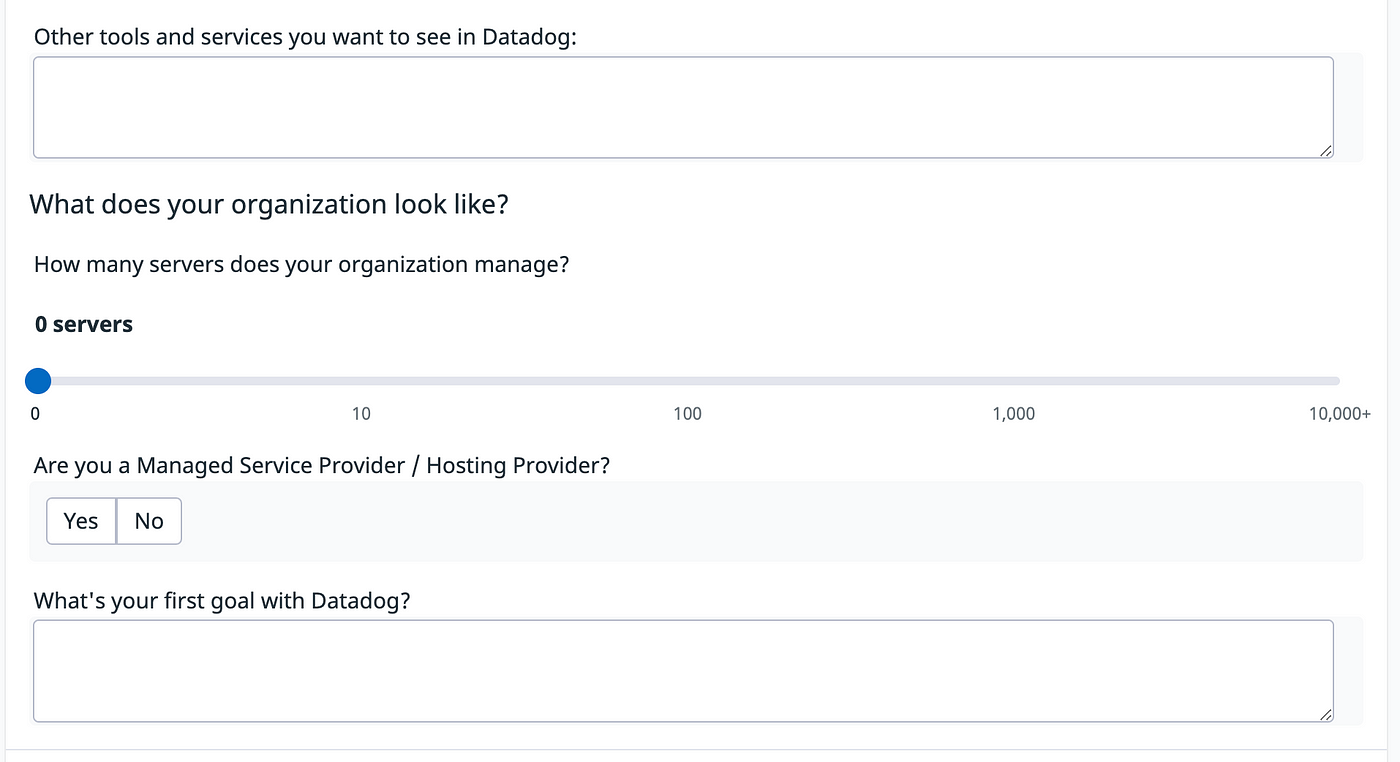
You can sign in to the Datadog dashboard and use it for free also, many services and tools are available for free, let’s see the pricing of the Datadog dashboard.
Sign-up in Datadog
This is the sign-up page for the Datadog, we can also signup using Google.
After Sign-up we will land up on the stack page.

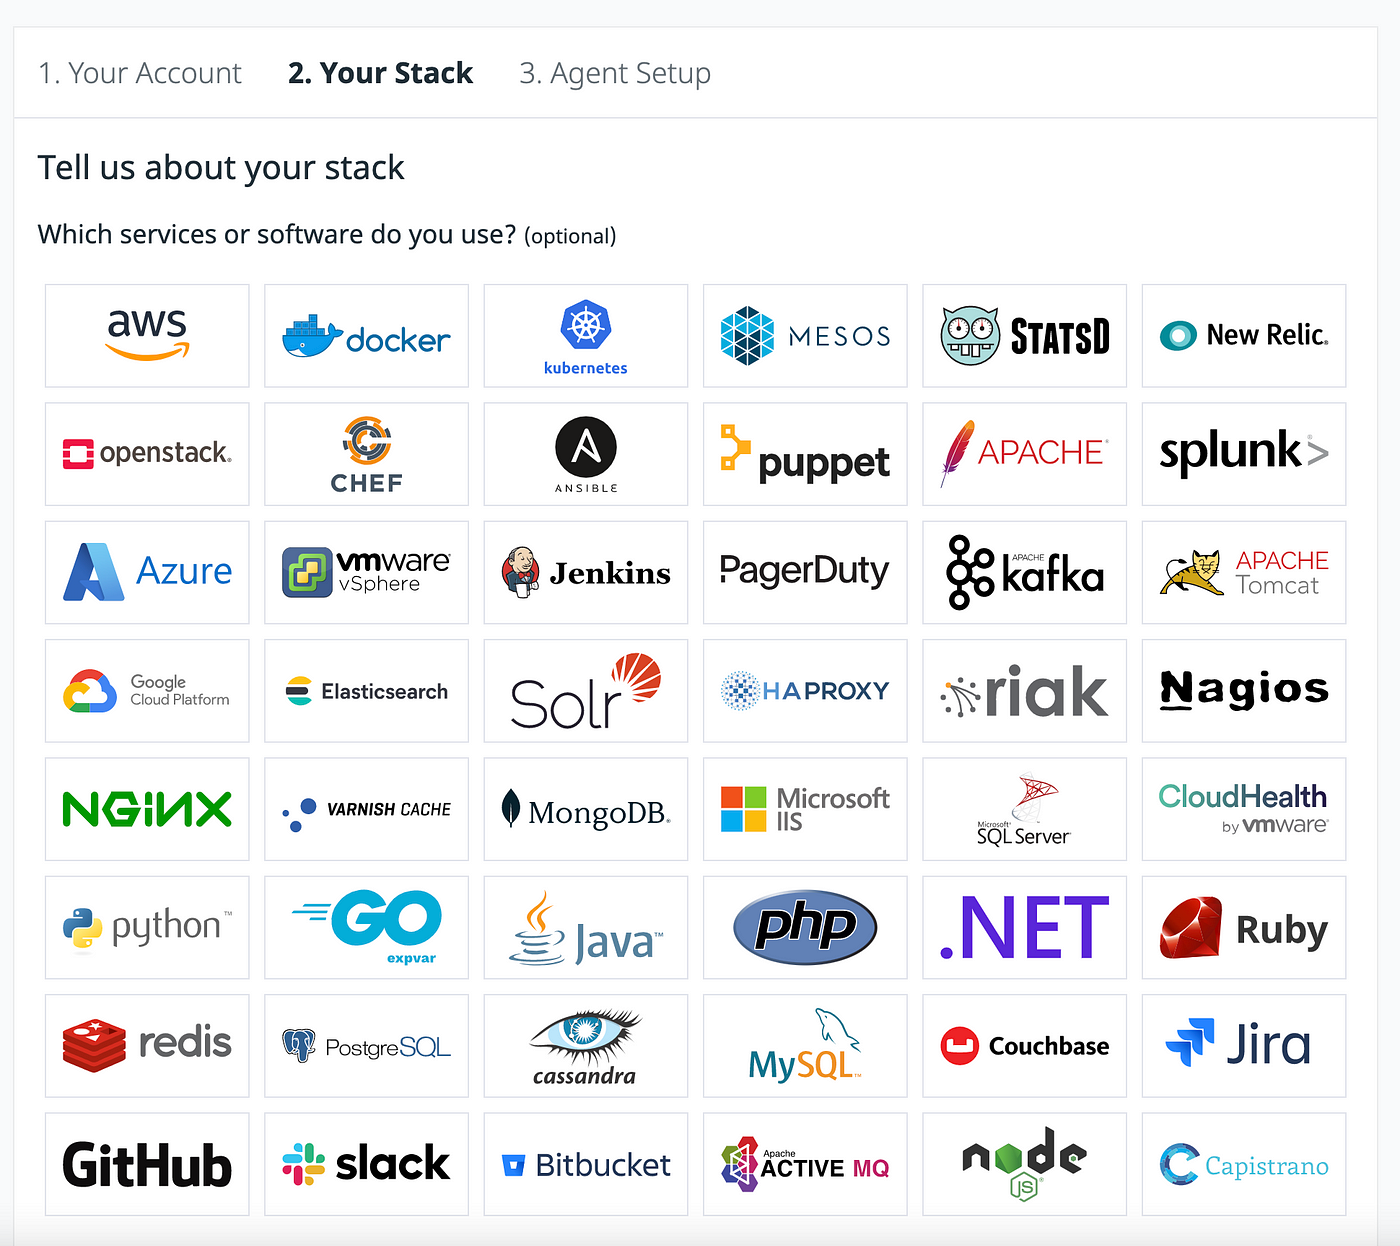
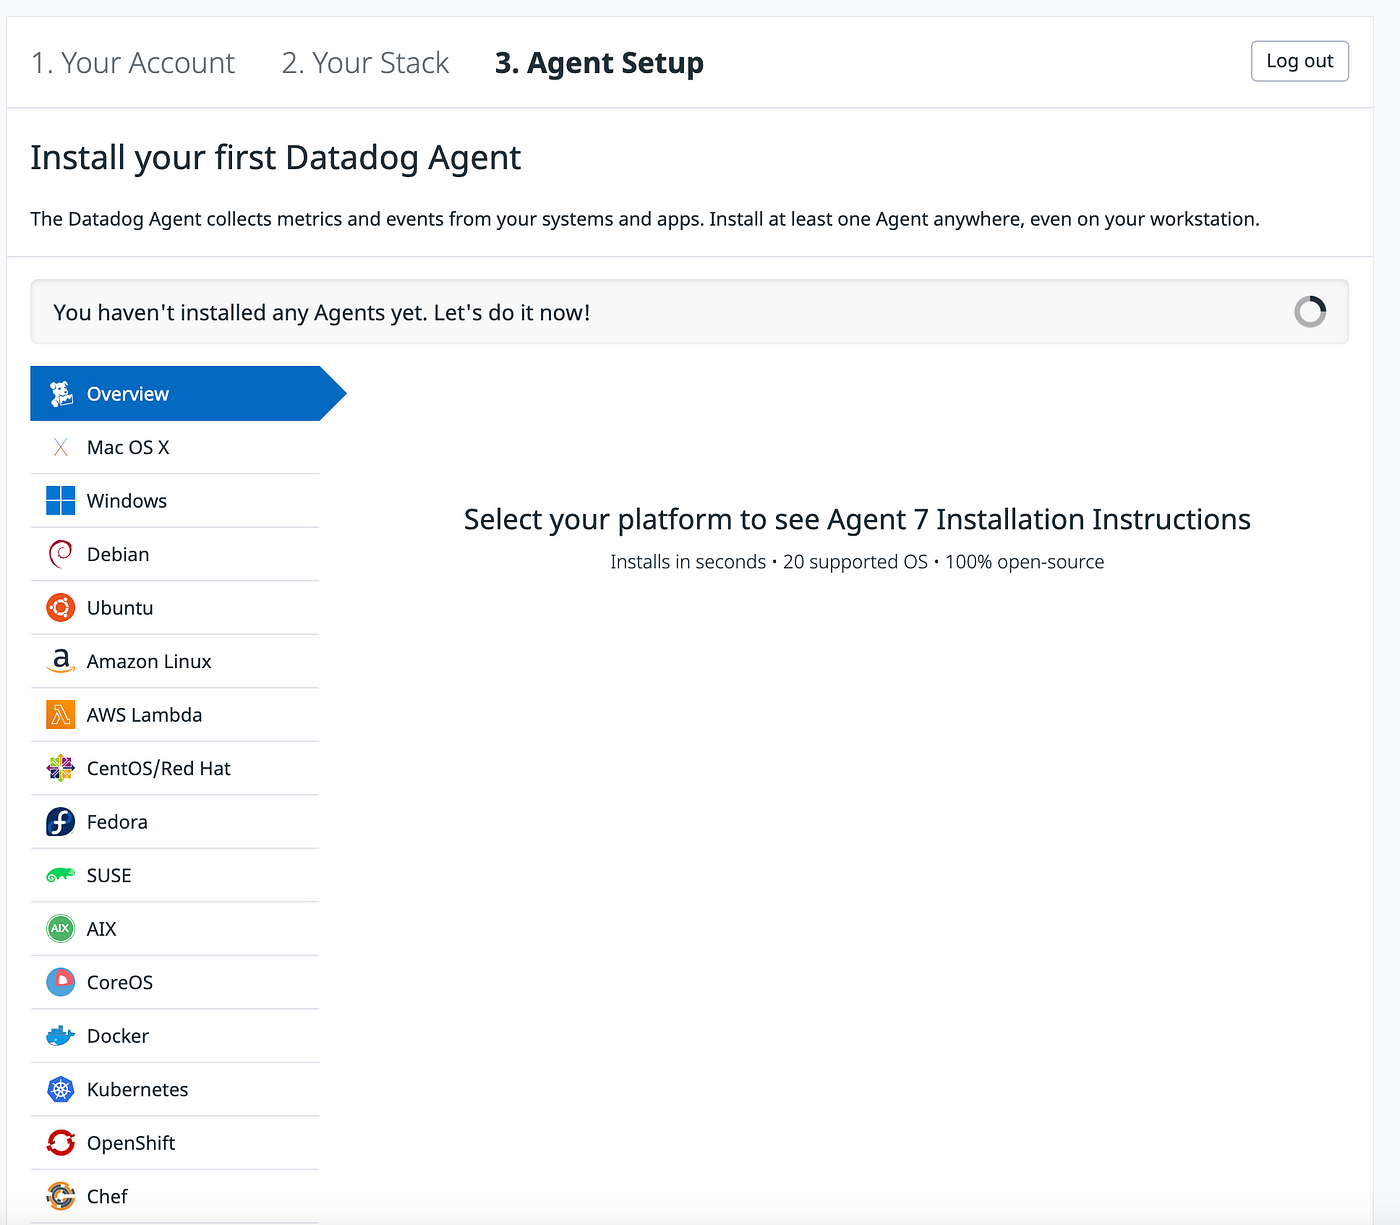
After the stack page, we will end up on the agent setup page. Here we need to select where we want to use Datadog.
We can also skip this part and can directly go to the main dashboard.
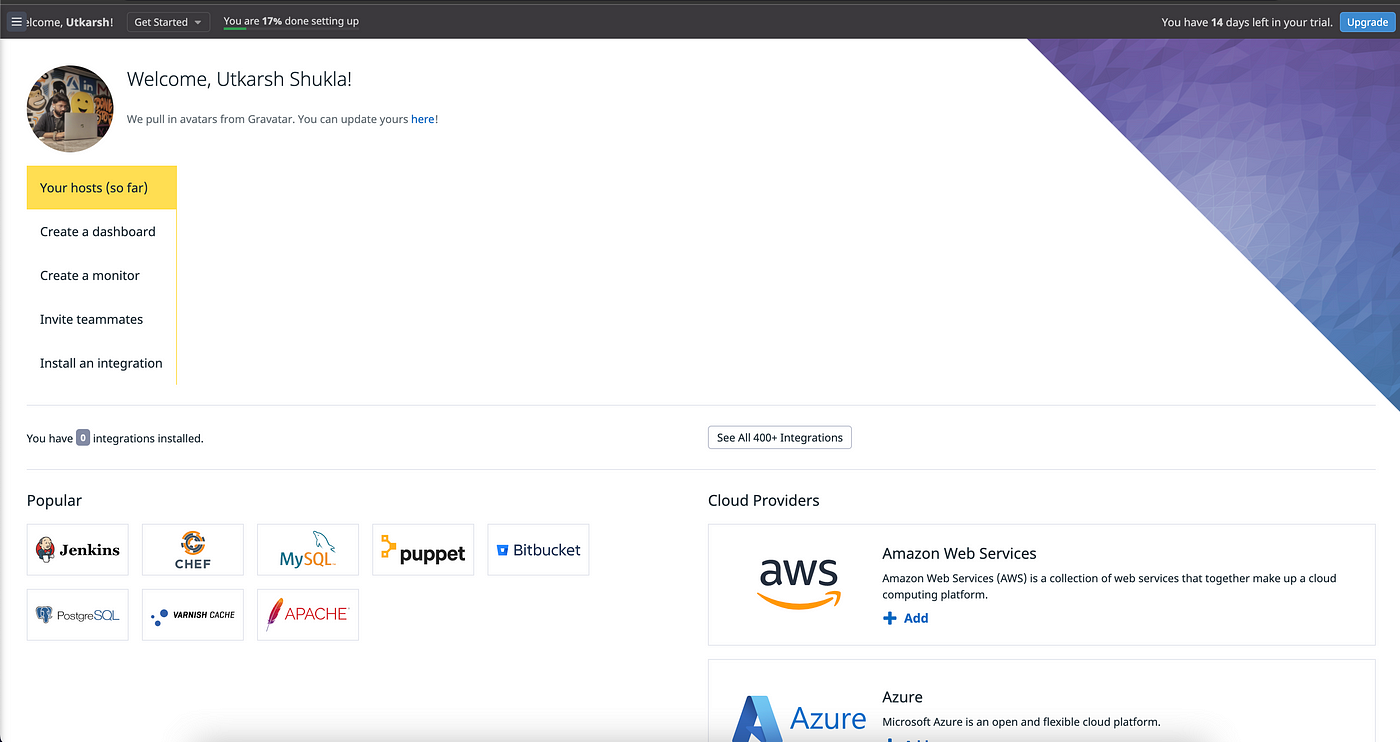
This is what the main dashboard looks like.
All your integrations, dashboards, and services will be visible here.
Monitoring Dashboard for your System
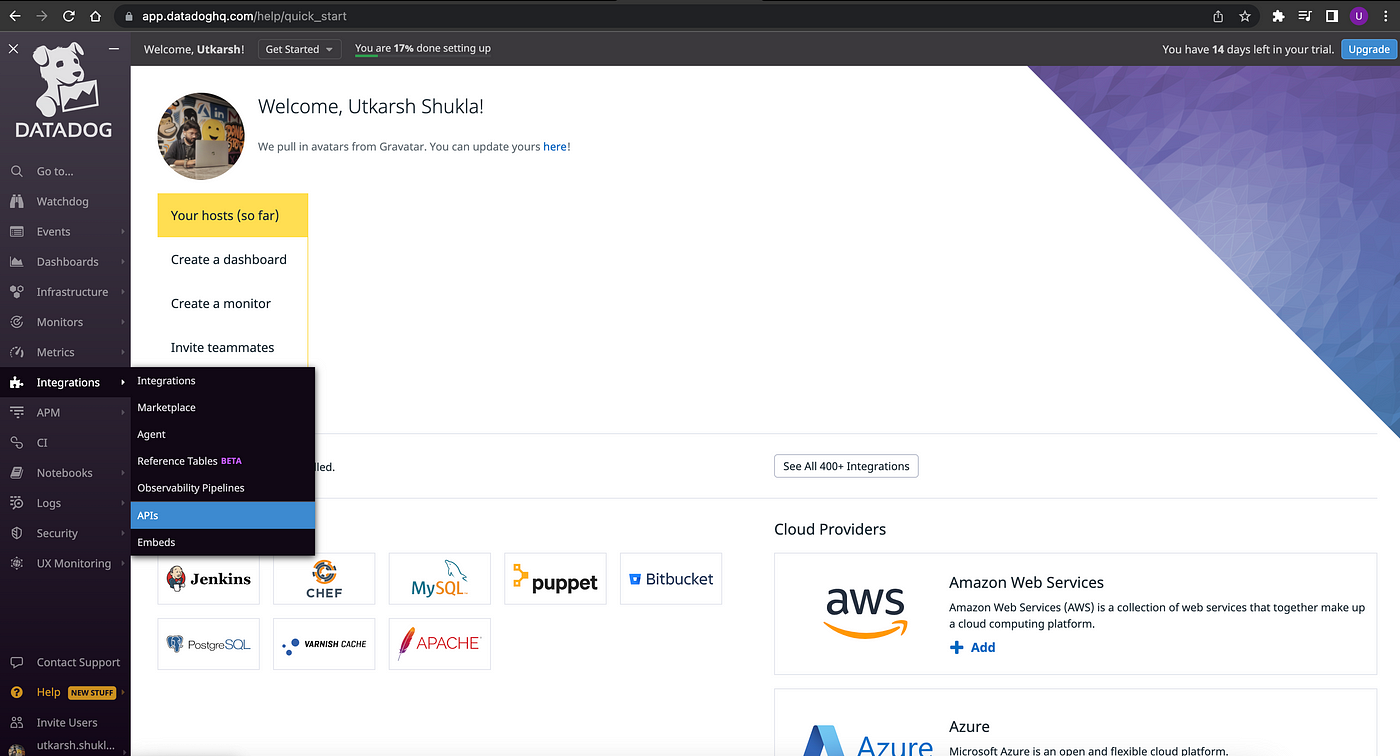
We will be monitoring the health of our system, and for that, we will be installing the Datadog agent on our system.

We need to go to the integration option and from there we will be selecting an agent, and from there will choose the system we want to monitor. For this blog, I want to monitor my own machine so I will be choosing the Mac OS X option.

Then we just need to follow these three steps and it will be installed on our system.

And now on the main dashboard, we can see that we have our one host sending data to Datadog, let’s see what it looks like.

This is the graphics for the infrastructure map. I have blurred the hostname cause of the security reasons.
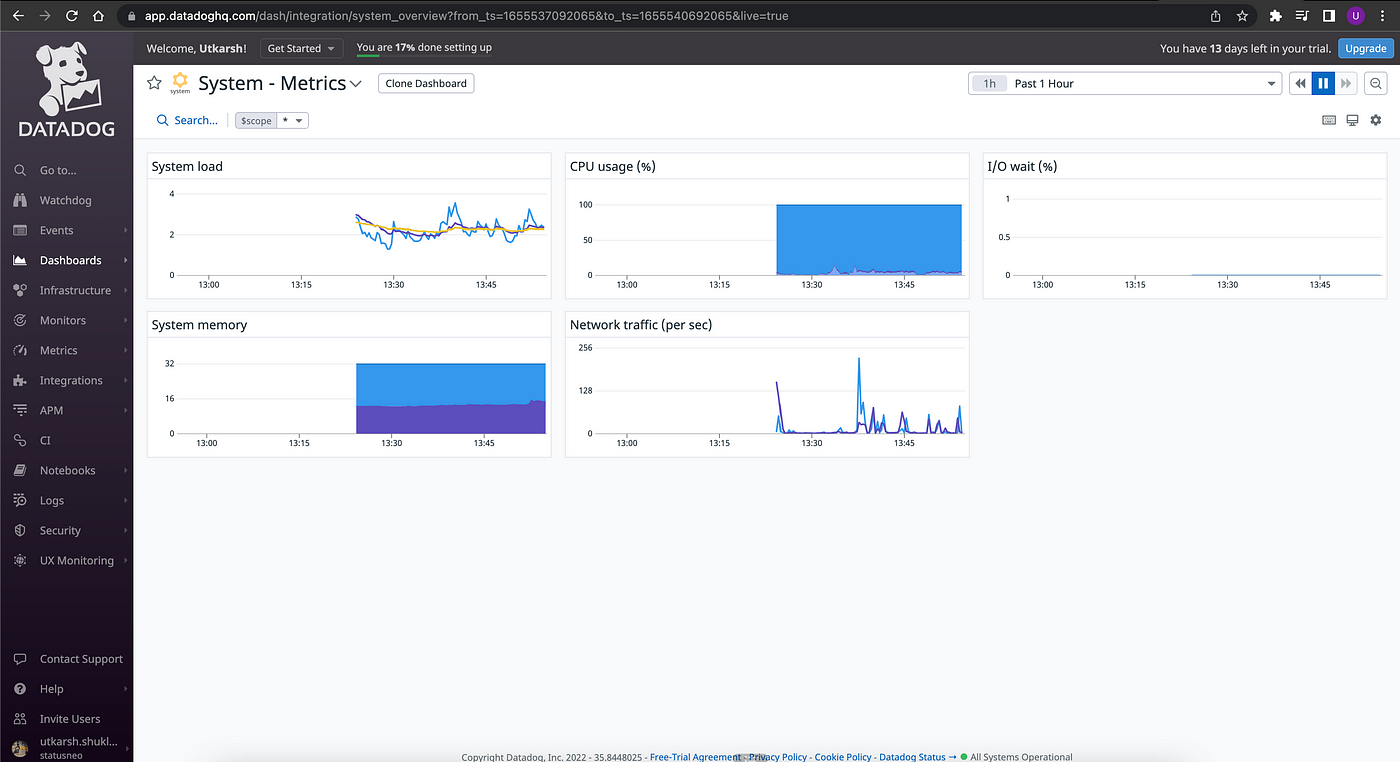


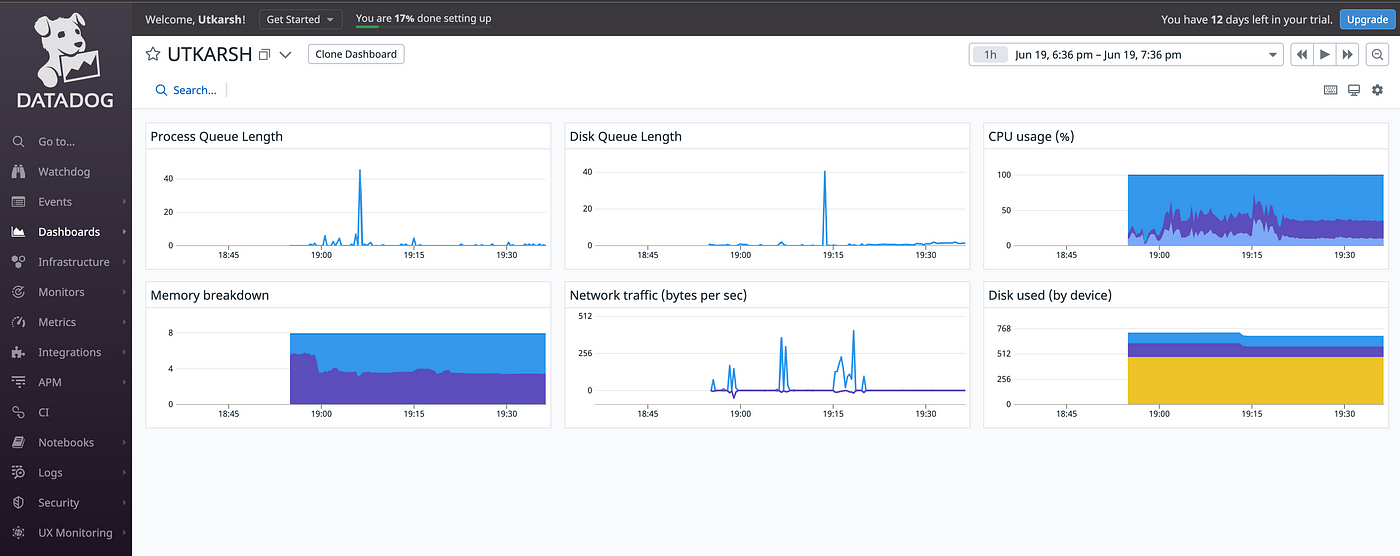
Here we can the system overview we different metrics available, that we can use to monitor our system health.
This is how easy it is to use Datadog with your system.
Monitoring Dashboard for the Python(Flask) Application
For monitoring of the dashboard, we will be using our Flask API to generate the logs, let’s have a look at how to do it. We need to go to the menu, and select integration, from the integration we will be selecting the API option.

from the organization set in the APIs options, we can find the API Keys for our project.

After getting the API key, we will be creating the client token for our application, for that, we need to go to this page and click on the new client token.

Once, you have created your token, it will look something like this.
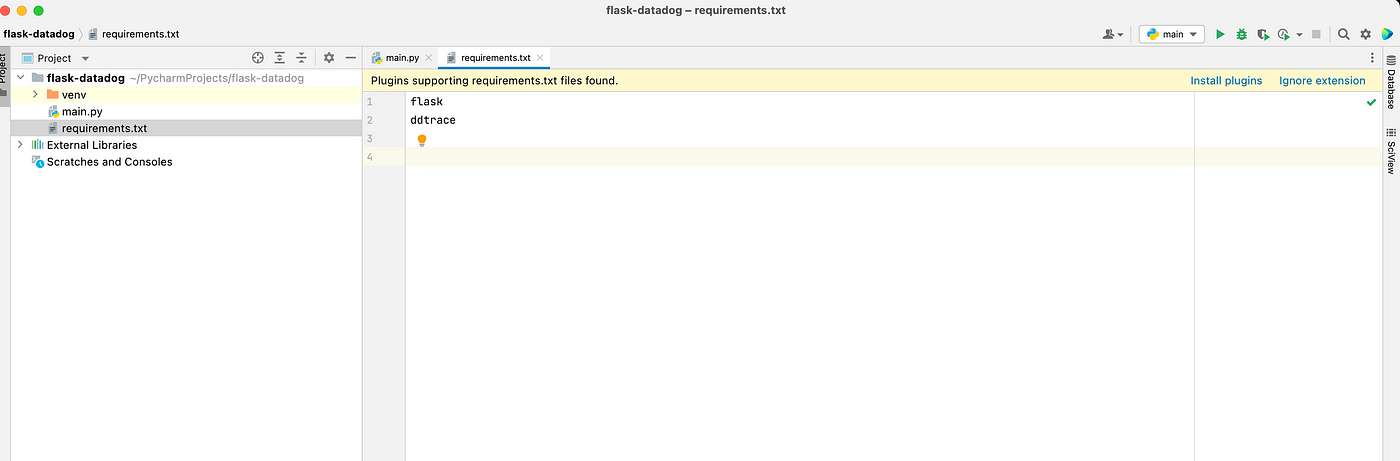
Flask Application
Now let’s create our flask application and name it flask-datadog. We will have our main.py file in it, where we will define our configuration. The external library that we are going to use will be flask-datadog. All the external dependencies will be mentioned in the requirements.txt file. Let’s create the file structure and see what it looks like.
We are going to install the packages by running-
pip3 install -r requirements.txt
Once the packages are installed, let’s move to our main.py file and see how to add the ddtrace library there and use it to generate logs.

This is the structure of our main.py file, here we have created a GET API, which will hit an open-source API that will bring the Covid Tracking dataset.
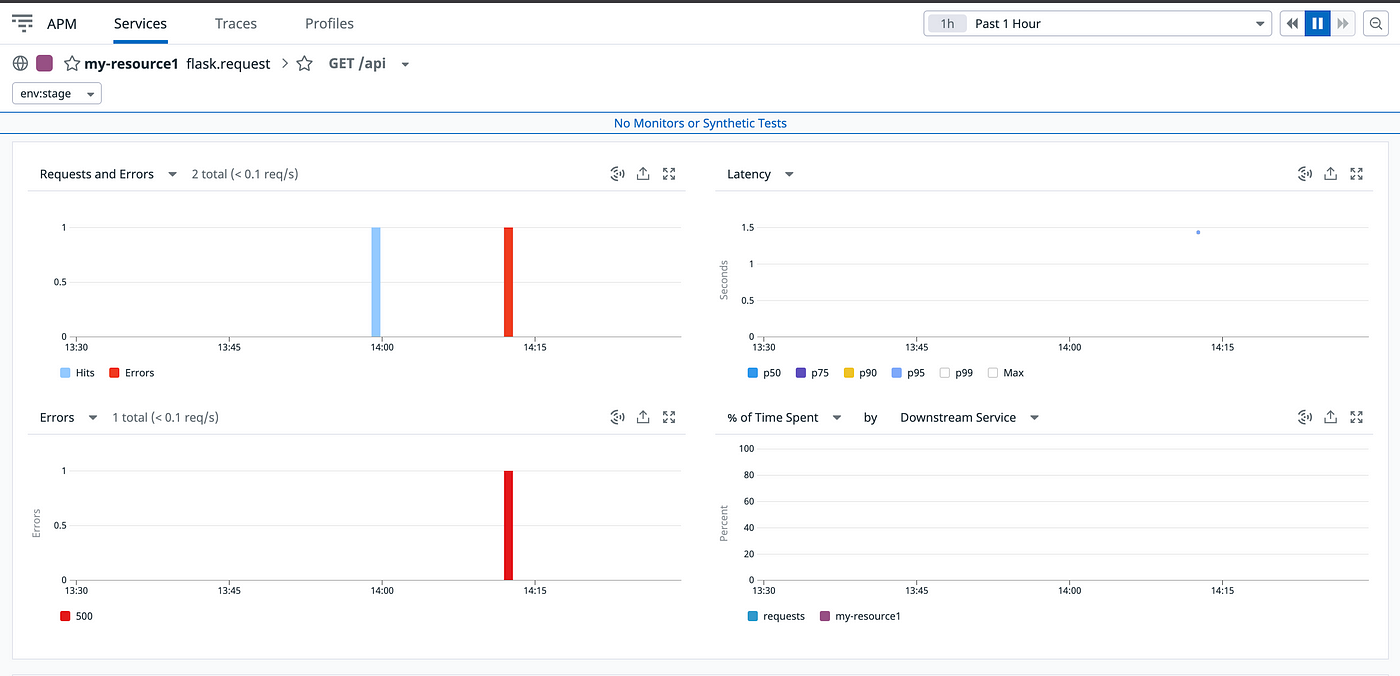
We have used the ddtrace wrap decorator at the top of the API so that we can monitor it. The name of the resource that we have given is my-resource1, on the Datadog dashboard logs will be available by this name only.
Github link to the code- https://github.com/Utkarsh731/flask-datadog
Now let’s see how to run our app.
FLASK_APP=main.py DD_SERVICE=”my-resource1″ DD_ENV=”stage” DD_LOGS_INJECTION=true ddtrace-run flask run — port=4999
By default the Datadog agent and flask both of them use a 5000 port number, so to overcome this we have changed the port of the flask app to 4999.
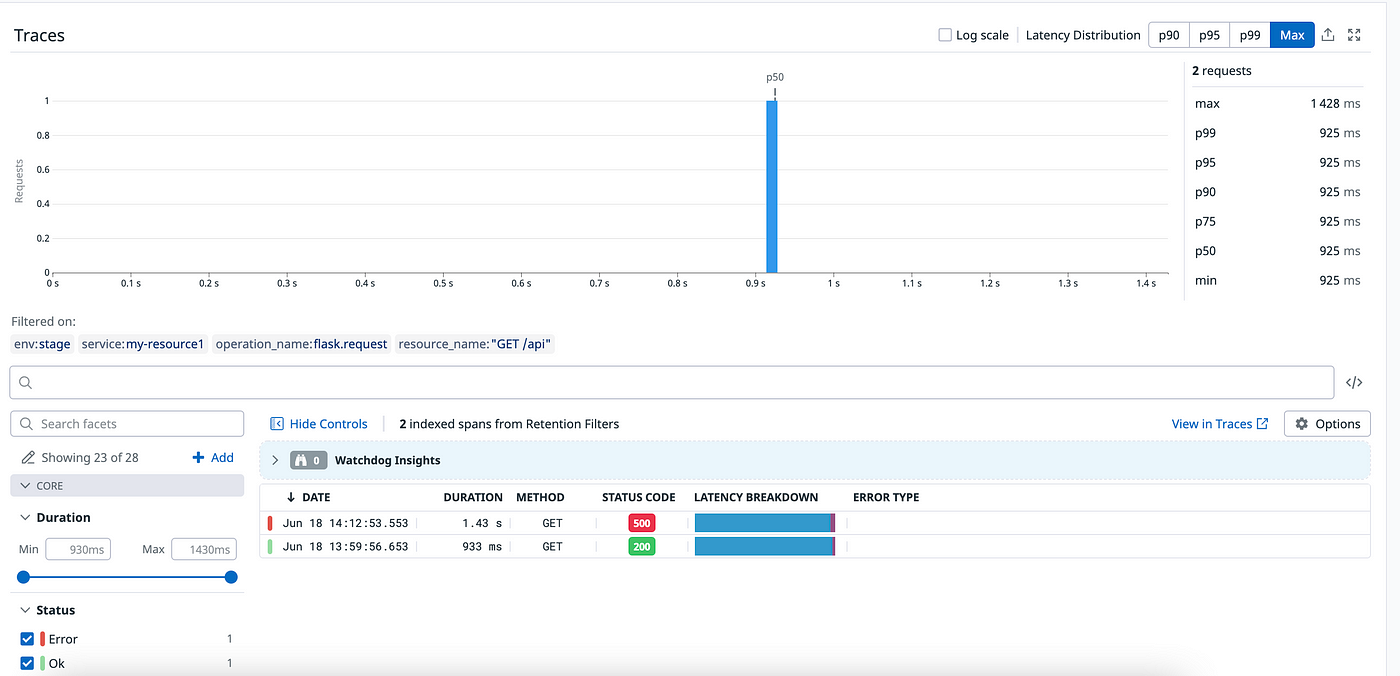
After that, we triggered the API multiple times also creating different response scenarios so as to have a complete monitoring list.
Let’s go to the Datadog dashboard and see what it looks like.
From the dashboard, we need to go to the APM and form the APM we need to select the Services option, like this-
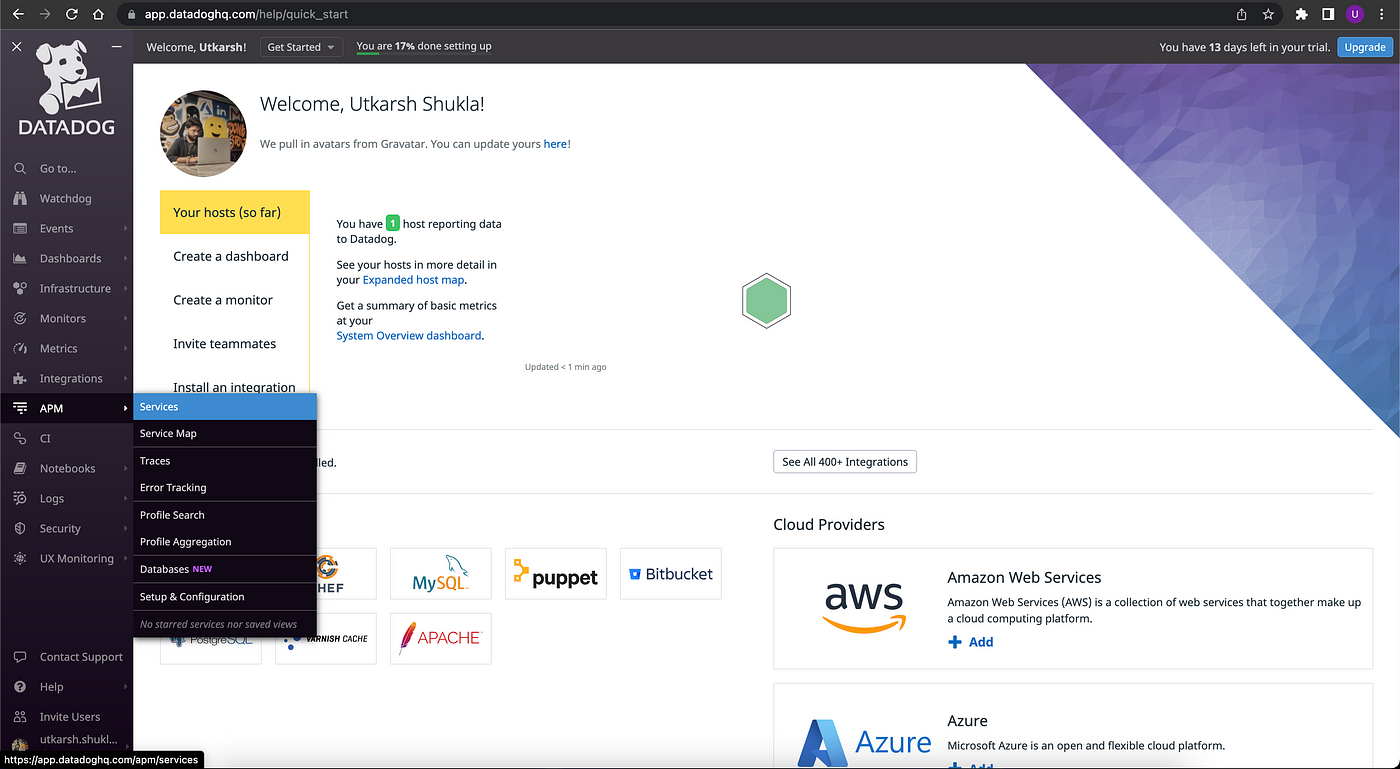
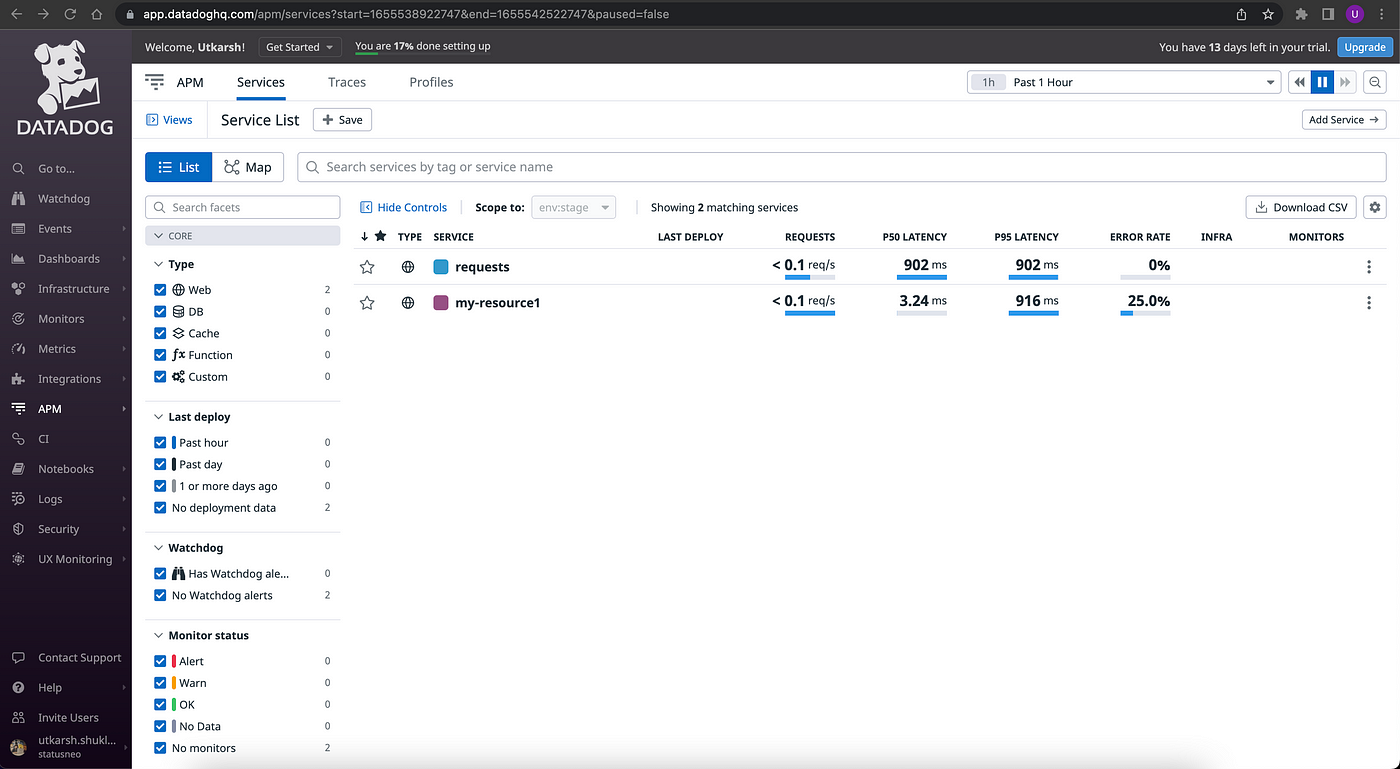
The service page will look something like this, here we can see our my-resource1 service up there and also the requests service. Not only you can visualize it but also download the entire data in the form of CSV from the download CSV option.

These are the completing monitoring metrics that are available in Datadog, not only that we can also customize them as per our needs.
Conclusion
That’s it from this blog, for now, thanks for reading. I hope you have learned something from this. Do let me know if you have any queries. Visit the below links to know more-
Still Curious? Visit my website to know more!
For more interesting Blogs Visit- Utkarsh Shukla Author
Github link for the code- https://github.com/Utkarsh731/flask-datadog