


Geographical Data Visualisation Using Kepler.gl and python
Geography - I was not so good at it in school. Even I am not so good at it now.
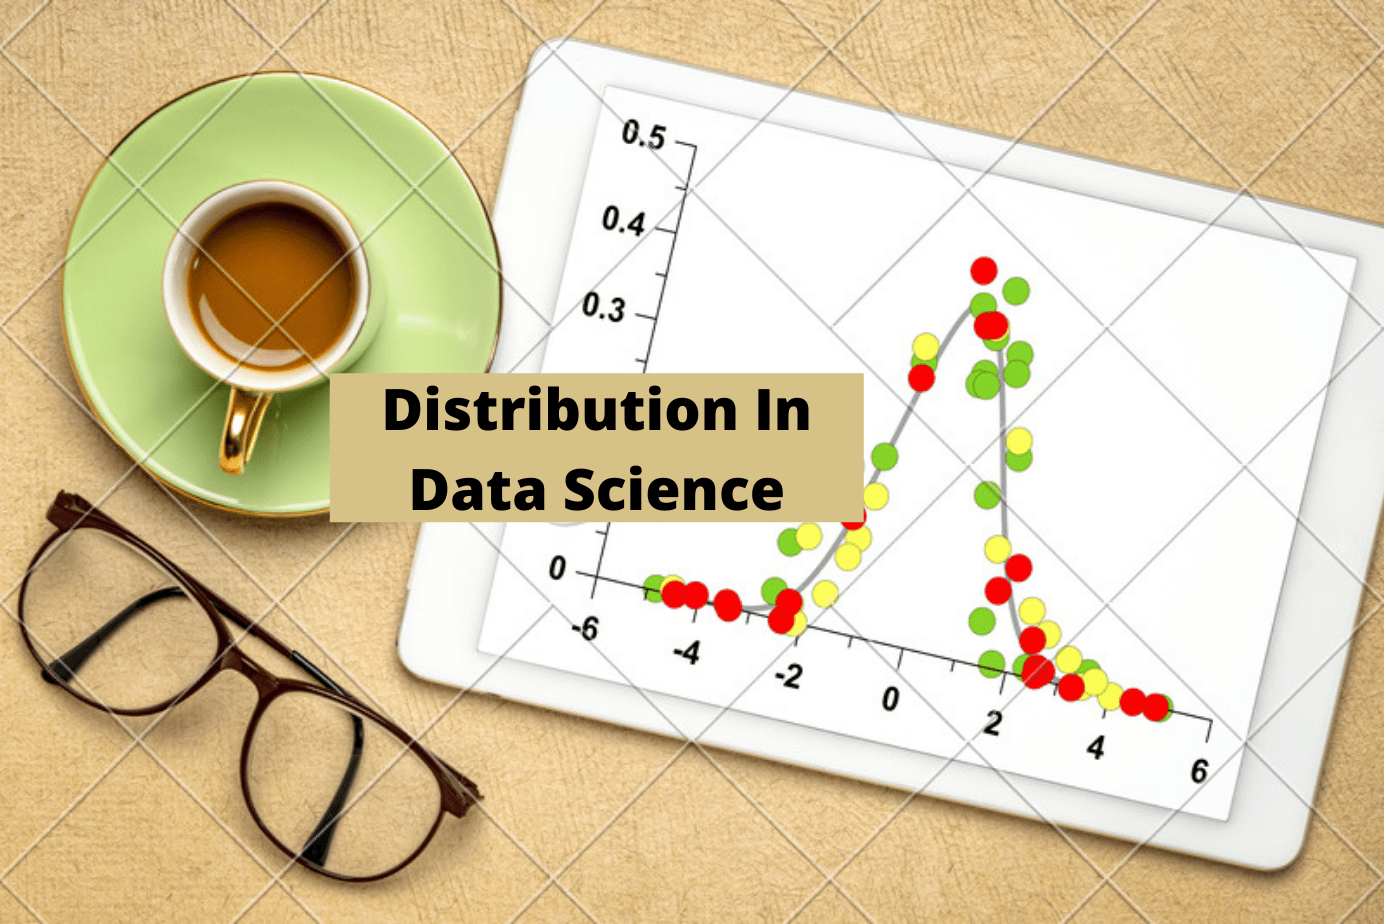
Distribution in Data Science
Discrete1. Binomial
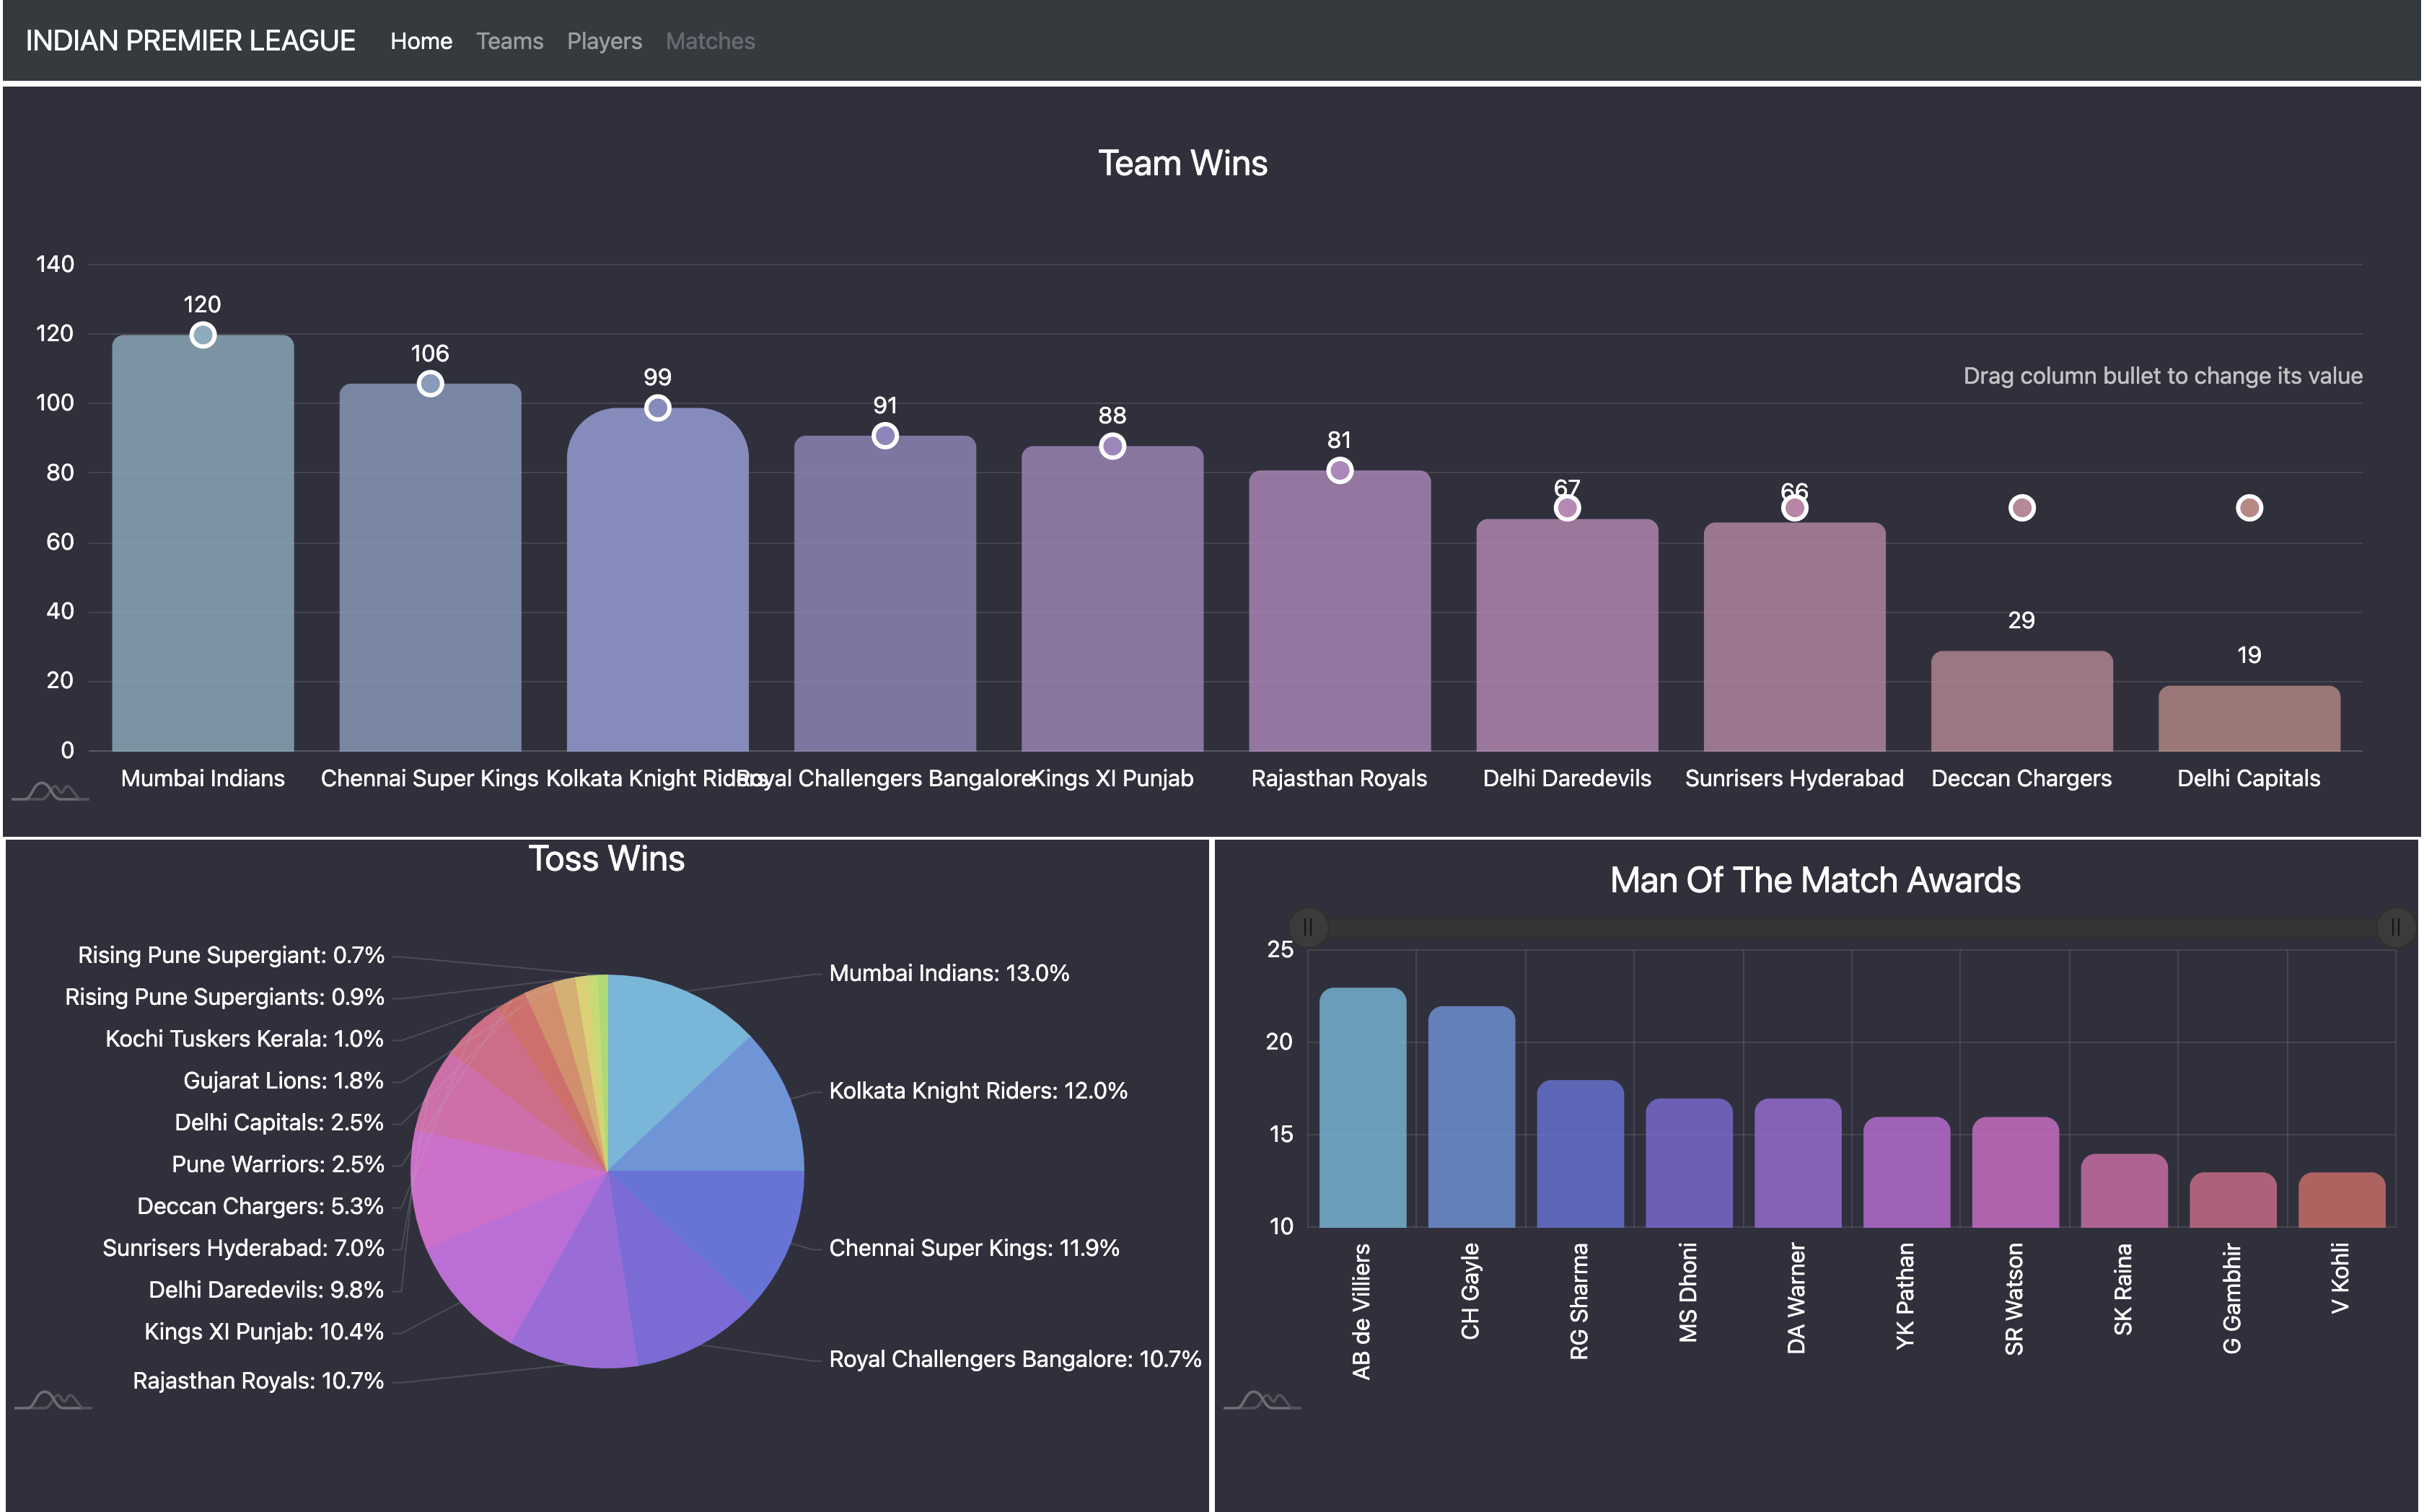
IPL(Indian Premier League) Dashboard using Flask, AmCharts, and MongoDB
IntroductionIPL as we all know is one of the most decorated cricket premier leagues in the world.In this blog, we
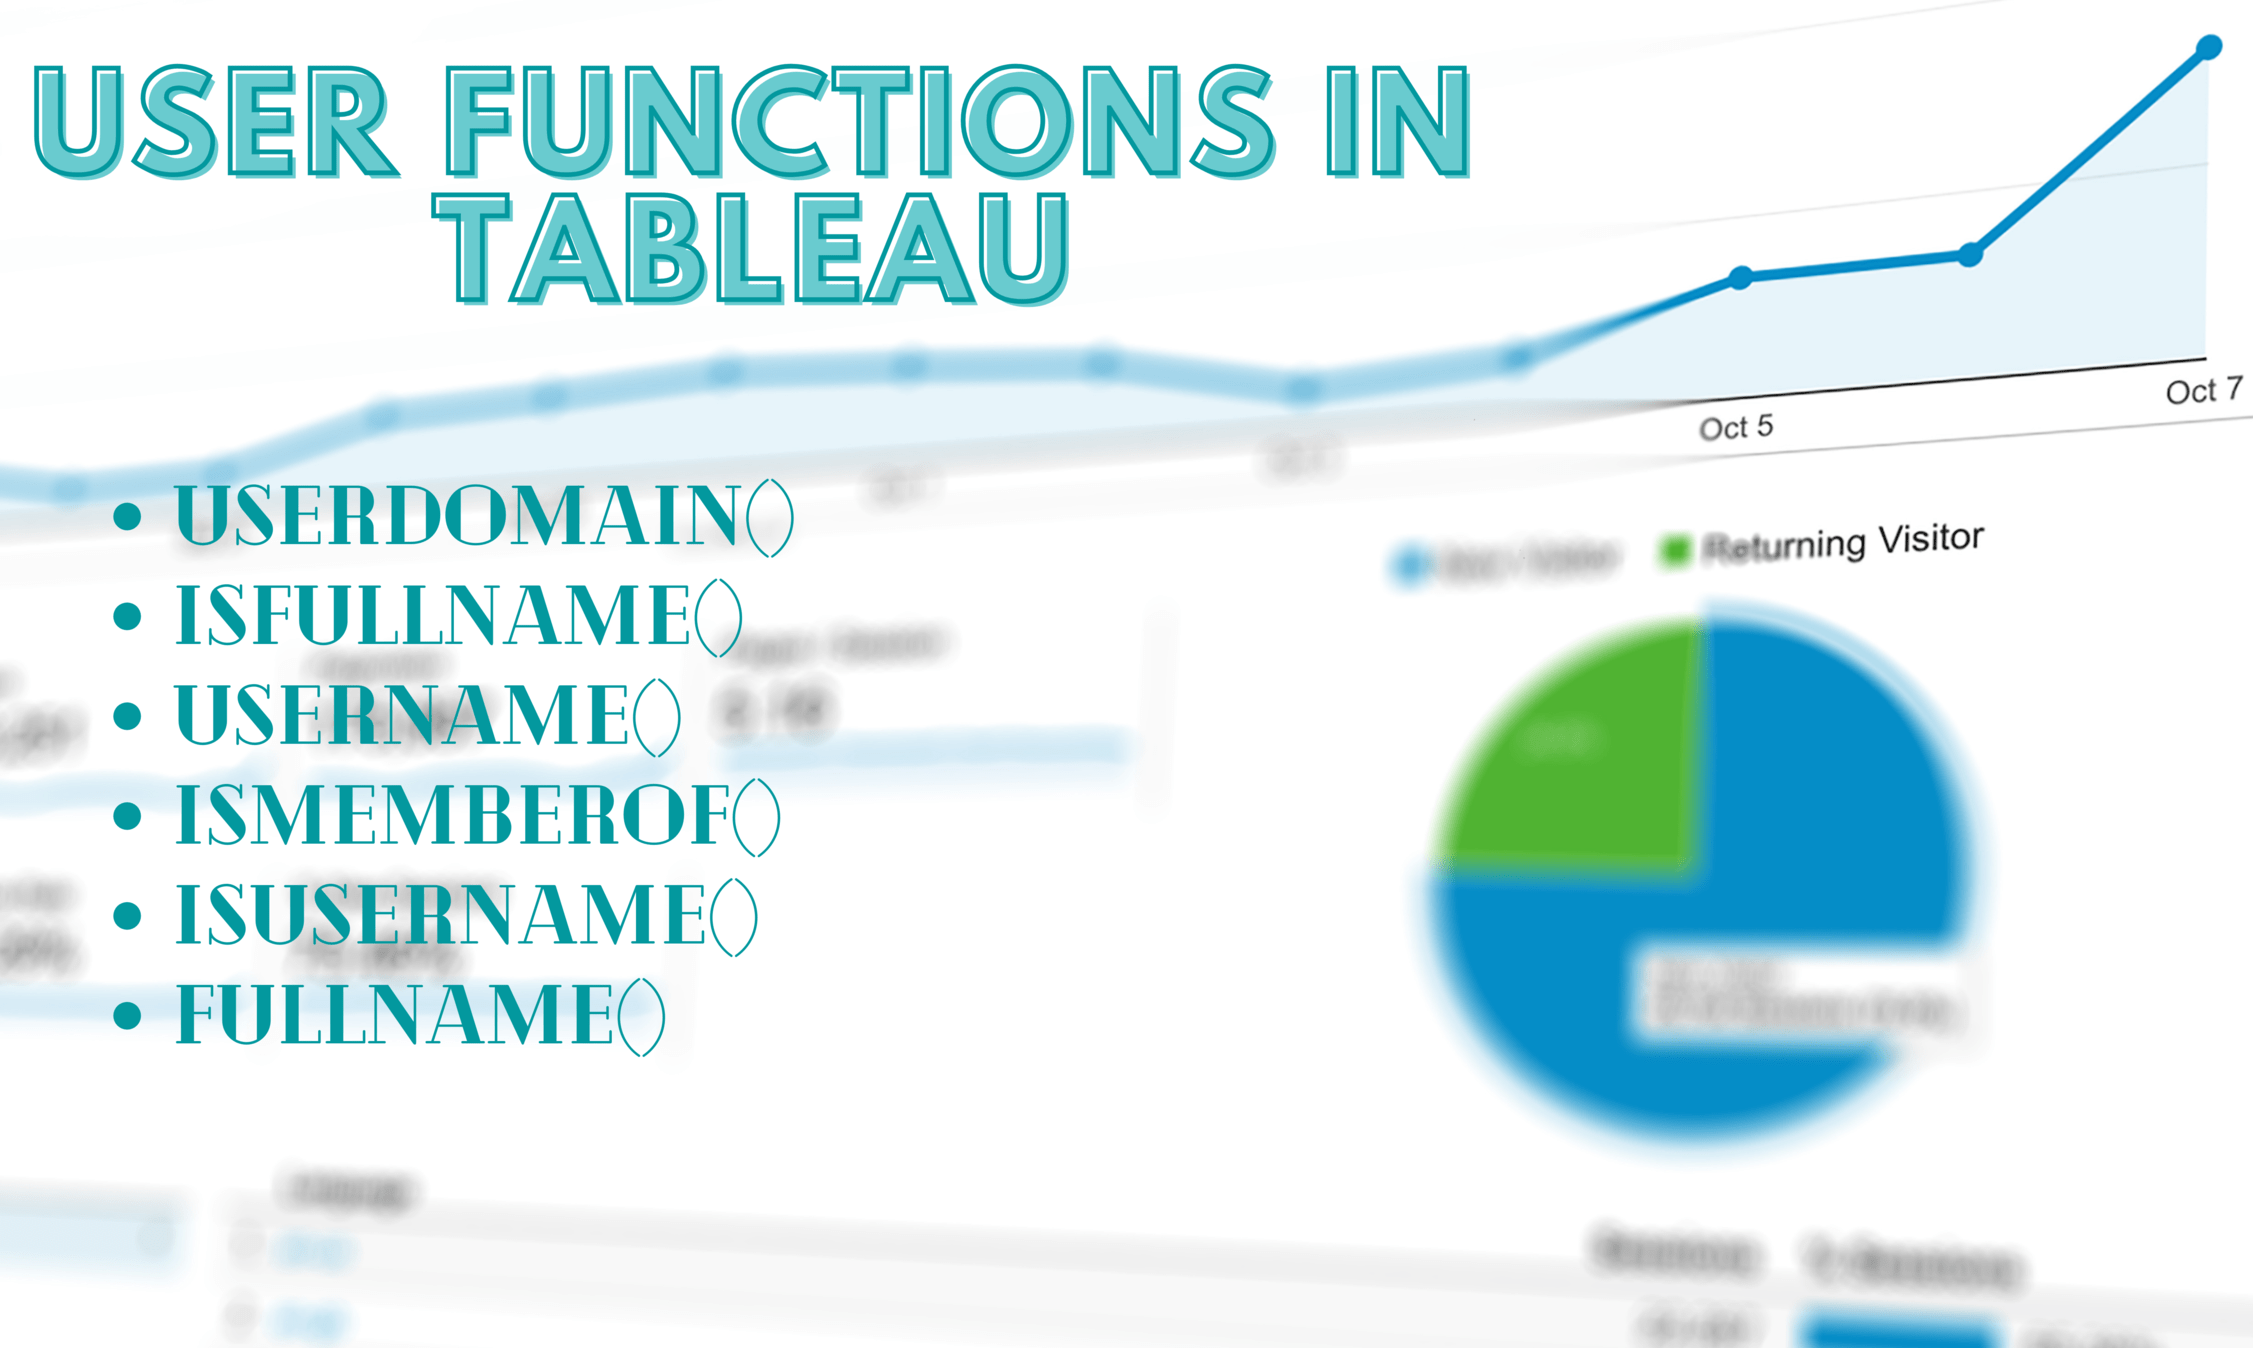
User Functions in Tableau | Row Level Security
What are User Functions in Tableau?User Functions are used to create user filters and row-level security filters. These User Functions
Remove duplicates in tabular data having high cardinality and degree | Optimized Approach
If you're into IT or related business, then at least once in a lifetime you come across a situation where

Tableau – 7 performance tips you SHOULD know about
Introduction and PrefaceIn this blog, we will be discussing how to make a tableau perform at its best. Tableau performance

Decision Tree Algorithm- Machine Learning
OverviewDecision Tree Analysis is a general predictive modeling tool. It's applicable in several different areas. In general, the algorithms identify
Tableau – How to implement INCLUDE LOD and its benefits
Introduction and PrefaceToday we're going to be going through the third and final one, which is the include level of

Tableau – How to implement FIXED LOD and its benefits
We are going to be walking through the level of detail calculations. There are three types of level of detail
Tableau and Power BI – How to convert raw data into Meaningful Visualization | With Example
Tableau and Power BI is the most extensively used visualization tools in today's big data market. People thrive to learn