Introduction and Preface
Today we’re going to be going through the third and final one, which is the include level of detail calculations. If you remember or read the other two blogs on Exclude and fixed level of detail expressions. The fixed level of detail calculations will aggregate a measure at always the same dimension as a fixed dimension. Whereas, if you will exclude level of detail calculations will allow you to exclude a dimension that you aggregate a measure. Thus, include the level of detail calculations allows you to include a dimension when you calculate a measure when you aggregate a measure.
Check out our previous Blogs on Level of Details Calculations:
Implementation
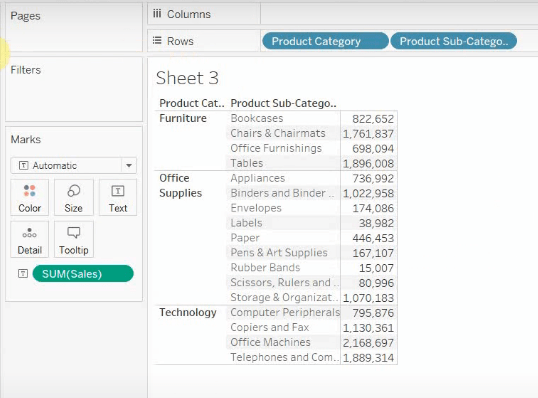
So what we’re going to go ahead and do is create the same table that we created in our other two dashboards. Here so we’ll drag the product category out onto the row shelf. And then pull product-subcategory out onto the row shelf adjacent. Then we’ll take our “sales” and drag it out onto the Text in the Marks tab. Here we have created a nice little table.
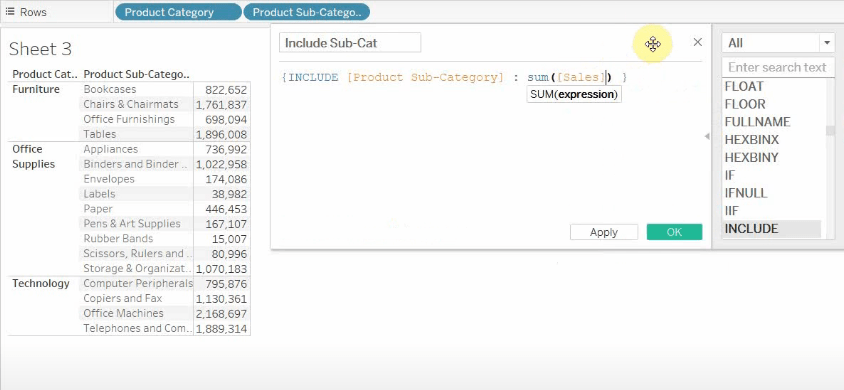
Now let’s go ahead and create a level of detail calculation that is a calculated field, therefore include subcategory and that is going to be a level of detail calculation where we include “product-subcategory” and hence find the sum of sales. You can see the screenshot below for better clarity.
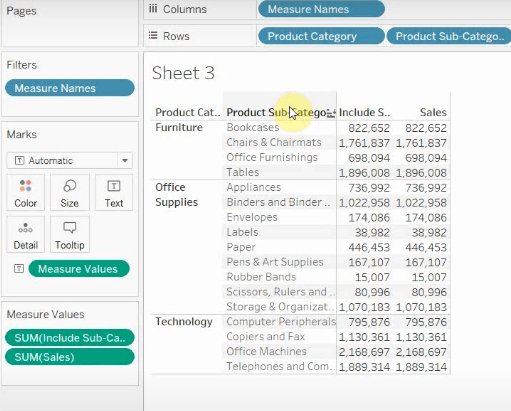
Further, this calculated field must be enriched into our table here. So you’ll see that at the moment these are the same because they’re actually aggregating the same way and we have a product subcategory in our view.
Where this gets interesting is when we remove product-subcategory from our view and we change the level of aggregation.
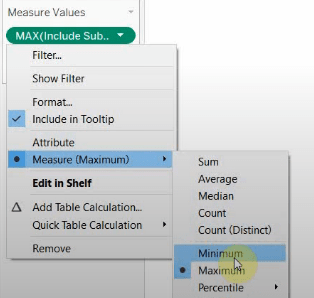
Hence, what we’re going to go ahead and do is we’re gonna change the level of aggregation to maximum and then we’re gonna take away product-subcategory.
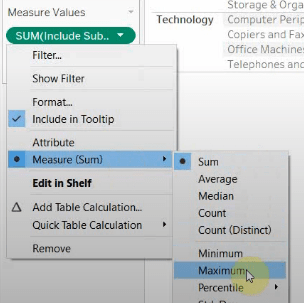
Now you’ll see here that now our include subcategory is different than our sales. What this include is doing is it’s calculating the sum of sales for each of the subcategories and then it’s taking the max for whichever one of those subcategories it thinks is the biggest.
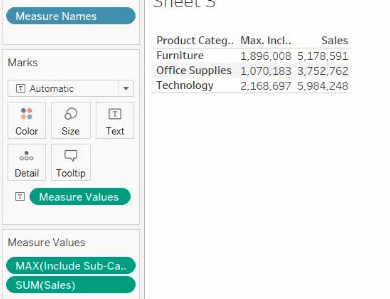
That’s what it’s displaying on here so if we put product-subcategory back, you can see that the maximum sum of sales within the furniture product categories for tables and that’s 1,896,008.
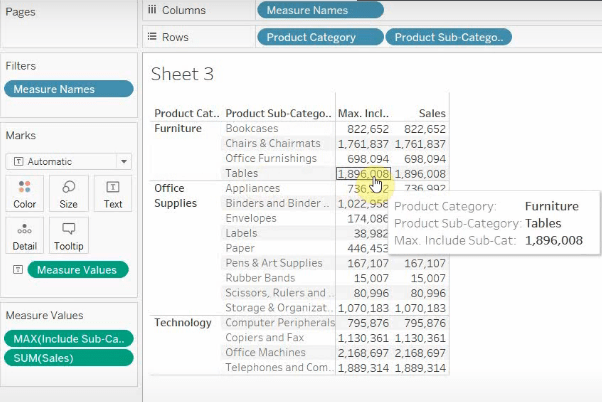
So if we take away the product subcategory and look at the furniture you’ll see that it’s 1,896,008. So it’s showing us the sum of sales for the product subcategory that is the biggest. If we wanted to change this to the minimum or to any other level of aggregation then change this to the minimum.
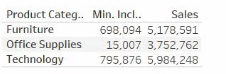
That’s going to show us the one with the smallest category so if we put product-subcategory back you’ll see that our smallest was office furnishing which is 698,094. We’ll take it away again to make an analysis further.
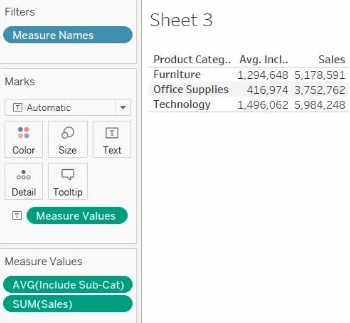
Then finally if we wanted to average. That’s gonna give us the average sum of sales for each product subcategory within that products category and that’s how you might use a level of detail calculation using include.
It’s a good way to get to different levels of measure so we can get the sales for the biggest subcategory within a product category as well as the total sum of sales for that product category on a visualization.
If you have any questions please leave the comments. We hope that you like the tableau tips and tricks that you got today.