Introduction
Data is today’s currency if we see it from the eyes of a Data analyst. In business, we deal with petabytes of data that can offer amazing insights about the business and can also help to take a necessary decision for future projections. One of the leading tools that data analysts love to use for visualization in Tableau provides high flexibility on using different charts, graphs, and dashboards. But one must know the tips and tricks to evaluate the necessary insights for the business from the business.
Today, I came across a problem that most BI developers face in Tableau, and hence, today I will help to solve the same for you step by step. Here is the problem statement.
Tableau Problem Statement
Find the top 5 best selling Product within the Subcategory of category and then display them in the view.
Step 1: Import the Data
I am taking the Superstore data as the sample dataset to solve the problem as this dataset can be easily found in the trial version of Tableau Desktop. So let us import the data and by selecting the same from the Data tab and drag the necessary columns into the view as shown in the picture below.
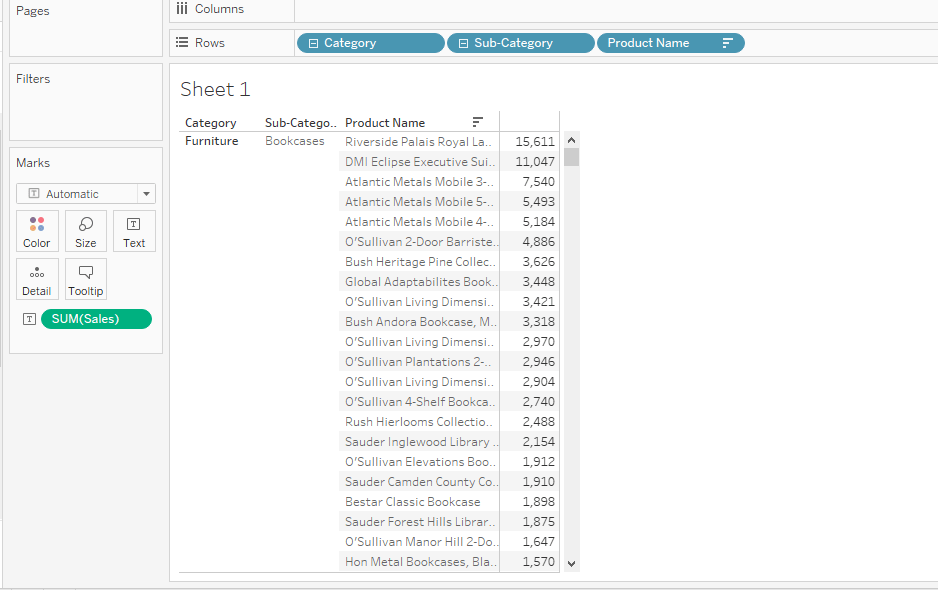
Dragging the columns: category, subcategory, and product in rows, whereas taking the Sum(sales) in the text tab.
Step 2: Creating the Rank function for Sales
Create the Calculated Field from the Analysis option on the tableau menu bar. Add the below formula for the Rank() function. From the Measures pane, convert the Calculation1 field into Discrete.
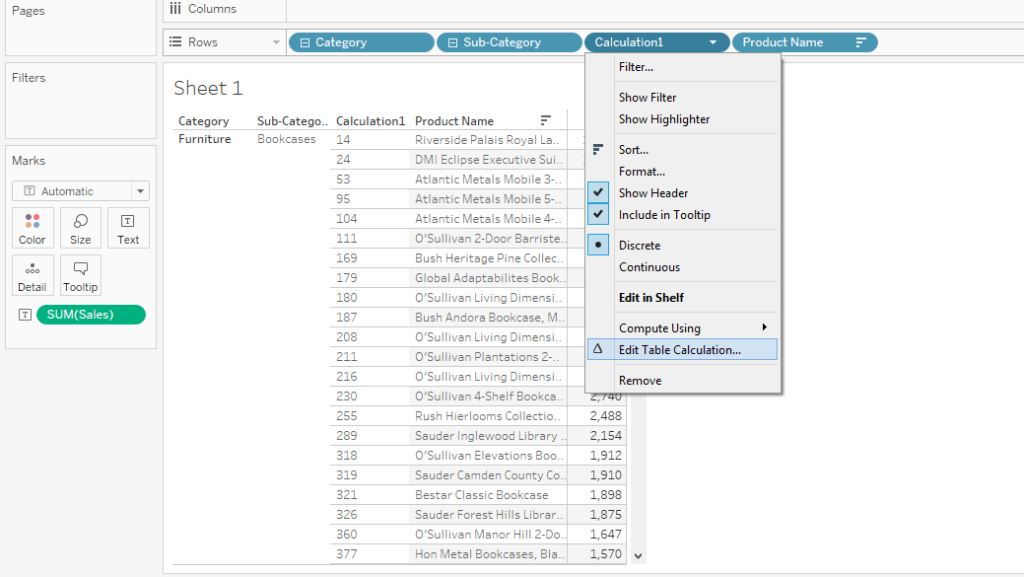
Step 3: Pull the Calculation1 field into the Rows and Edit Table Calculations
Drag this new calculated field in the rows before the Product name field. Right-click and select Edit Table Calculations.
Choose the Specific dimensions option and select the options according to the picture as shown below. Under Restarting every select Sub-Category.
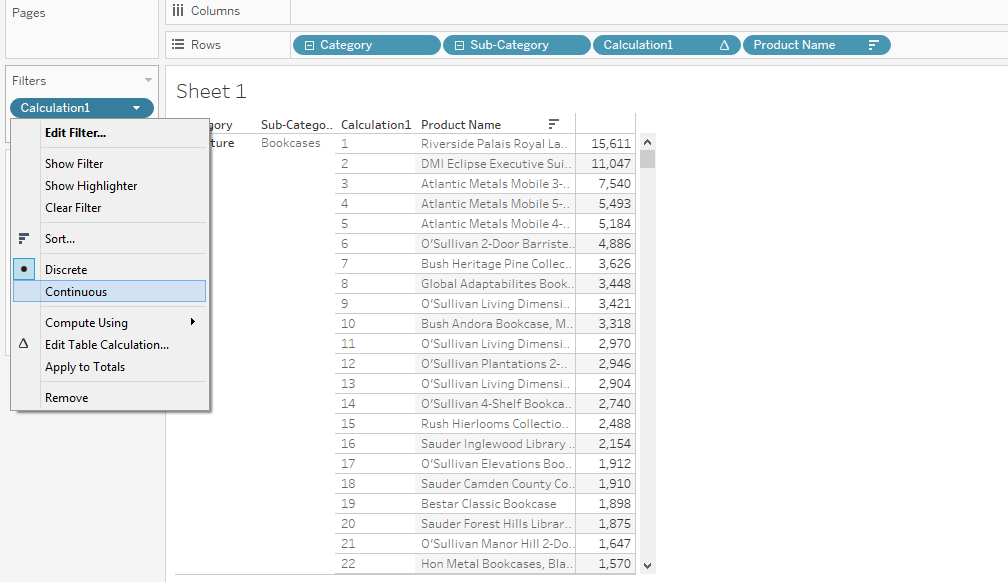
Step 4: Creating the filter from Calculation1
Using the Ctrl+ click the Calculation1 from the rows and drag it into Filters. Right-click on the filter and convert the filter to Continuous as shown below.
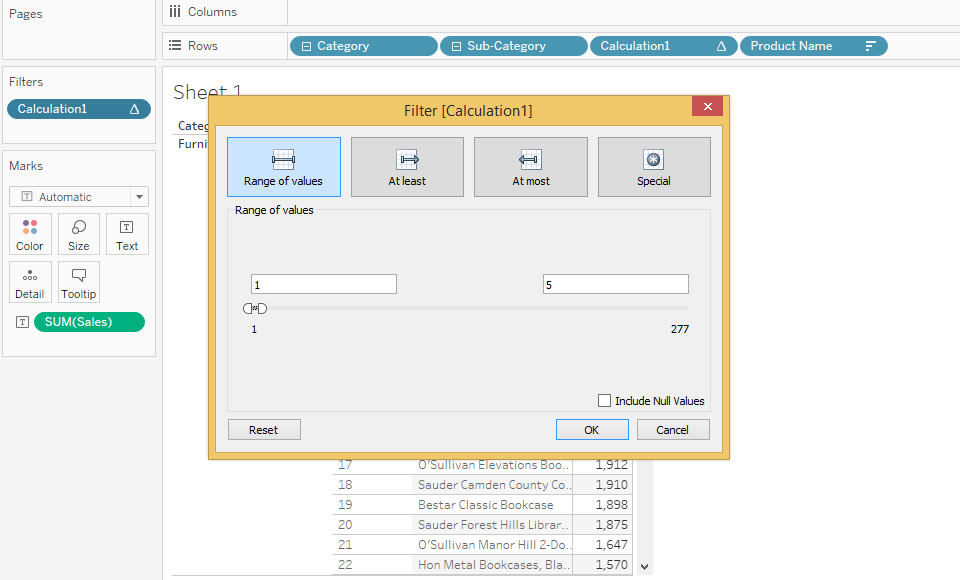
Step 5: Select the range from 1 to 5
By doing the Edit Filter option, select the maximum and minimum range to 5 and 1 respectively.
Results:
And here we are with our desired results.
I hope this Tableau problem is not a problem for you now. Share these tricks with your friends who are working or want to work in data visualization. Leave the comment below in case of any concerns or feedback.