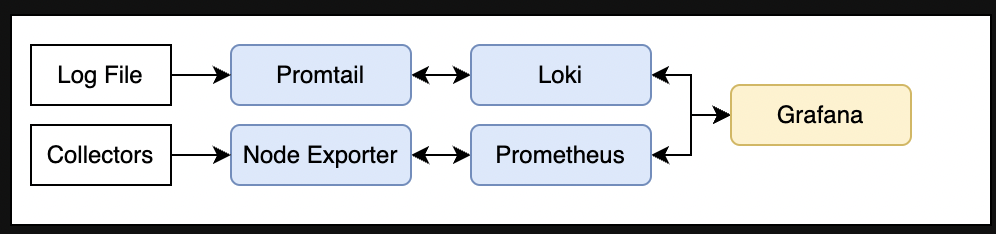
In this blog, I will be deploying PLG stack for monitoring and logging Kubernetes cluster with persistent volumes and integration with AzureAD and Azure Key Vault. I will be using AzureKeyVault to store AzureAD application credentials. Following is the diagram what we want to implement in terms of monitoring and logging stack.
Understanding the PLG stack
Before we deep dive into installing the PLG stack on a Kubernetes cluster, let’s quickly understand major PLG components. Once we have some essence of every components’ main responsibility, we can dive into installing PLG on a Kubernetes cluster via open source helm charts.
What is Promtail
Promtail is in charge for data ingestion into Loki. It’s implemented as a DaemonSet, which means an instance of Promtail runs on every node of your Kubernetes cluster. The DaemonSet periodically reads logs from all containers (stdout and stderr) running on that particular Kubernetes node. It can attach labels to logs before pushing them to Loki.
What is Loki
Loki is the heart of the PLG stack. It’s a data store optimised for logs. In contrast to other log aggregation systems, Loki does not index log messages itself. Instead, it indexes labels assigned with every log. We can query logs stored in Loki using LogQL, a query language inspired by PromQL. With LogQL, we can dive through millions of logs in seconds and also extract metrics from logs with ease.
What is Grafana
Grafana is used to visualise logs stored in Loki. Loki integrates seamlessly with Grafana. We can build individual dashboards in Grafana based on application logs and metrics computed from that logs.
What is Prometheus
Prometheus is a time-series database and alerting platform. Prometheus accumulates and stores its metrics as time series data ( i.e. metrics information is stored with the timestamp at which it was recorded, alongside optional key-value pairs called labels) and it comes with basic visualization capability.
What is Node Exporter
Node exporter is an official Prometheus exporter for capturing all the Linux system-related metrics.It collects all the hardware and OS level metrics that are exposed by the kernel. We can use the node exporter to collect the system metrics from all your Linux systems.
Implementing the PLG stack with PVs, AzureAD and KeyVault
We will be installing using open source helm charts. Following are commands to do same.
helm repo add grafana https://grafana.github.io/helm-charts
helm repo add prometheus-community https://prometheus-community.github.io/helm-charts
helm repo update
To get default values of used helm charts,
helm show values grafana/loki-stack > loki-stack-values.yaml
helm show values prometheus-community/prometheus > prom-values.yaml
Create a storage class
This is to create a namespace named monitoring and a storage class named monitoring-stack-volume with below mentioned properties in sc.yaml. This storage class will then be used to create persistent volumes for deployment of Loki, Grafana and Prometheus. Persistent volumes (PVs) will be created by sample values files provided in the next steps.
sc.yaml
kubectl apply -f sc.yaml -n monitoring --create-namespaceCreate an app registration to integrate Grafana with AzureAD
This is to create an Azure AD “Application” that will be used for Grafana to communicate get access to Azure. For this step, the application will be used to identify user information. The Redirect URI is required for this Grafana integration. You’ll need you domain here and the value should look like this
https://<fill_in_public_dns>
https://<fill_in_public_dns>/grafana/login
https://<fill_in_public_dns>/login/azuread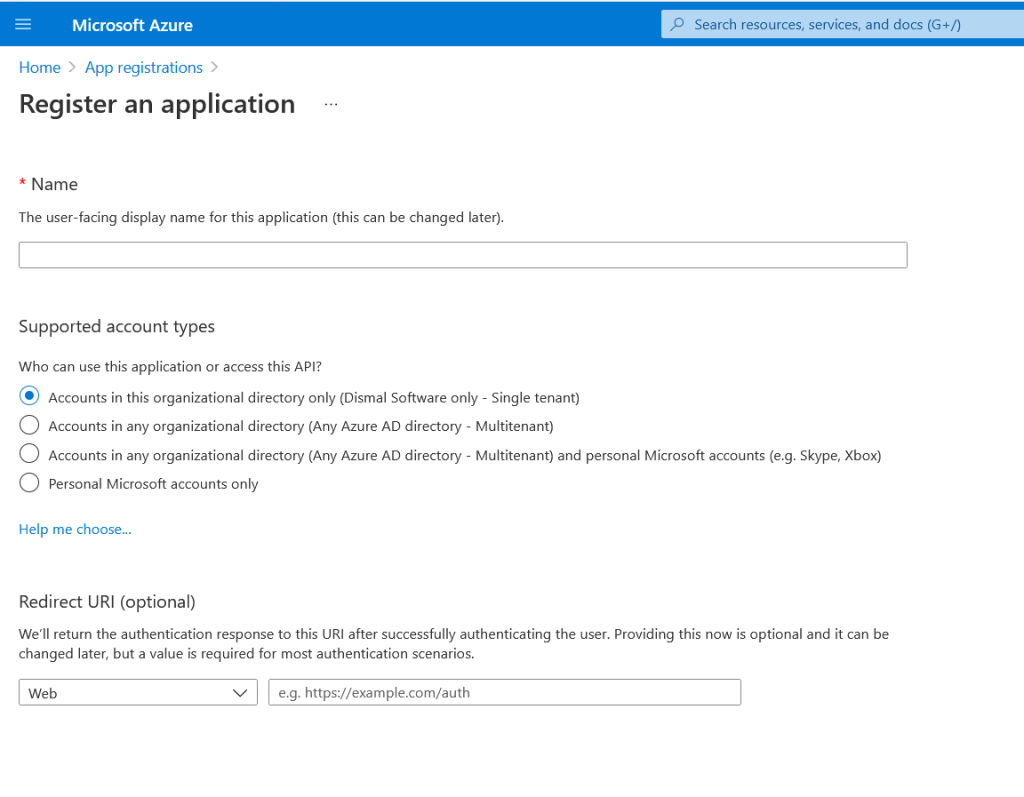
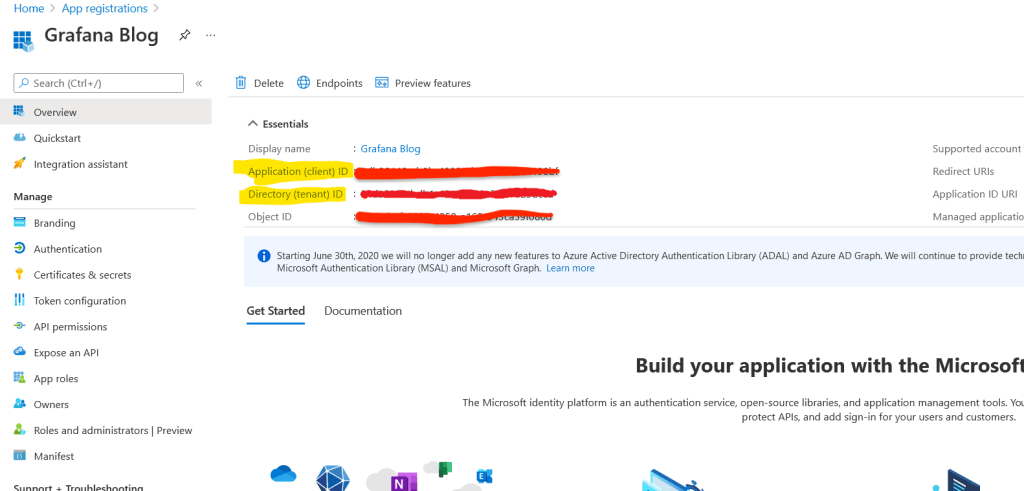
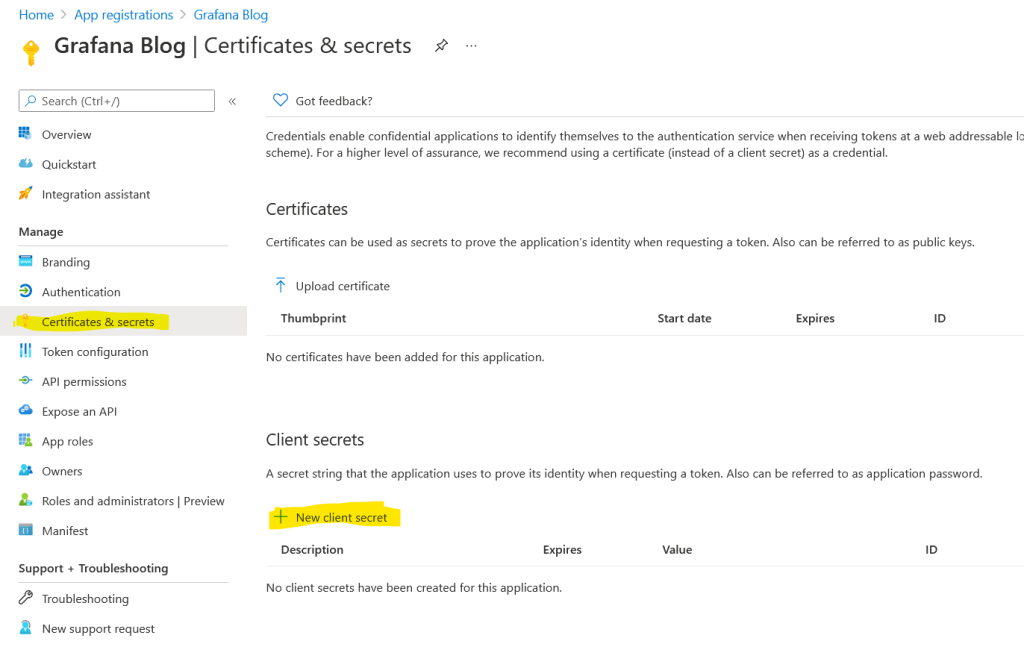
Please note down the value of client id, tenant id (application id )and client secret value. We would be creating secrets of client id and client secret value in KeyVault and passing tenant id in grafana configuration in the next steps. Please refer this grafana doc for creating roles and further understanding.
Create a KeyVault in Azure and enable KeyVault add on in AKS
After logging to azure portal, create a key vault with name grafana-azure-ad and two secrets with name grafana-azure-ad-client-id and grafana-azure-ad-client-secret having values as AzureAD client id and client secret created in previous step.
Run the following command on AKS cluster to enable key vault add ons.
az aks enable-addons --addons azure-keyvault-secrets-provider --name {{{{ fill_in_aks_cluster_name }}}} --resource-group {{{{ fill_in_resource_group_name }}}}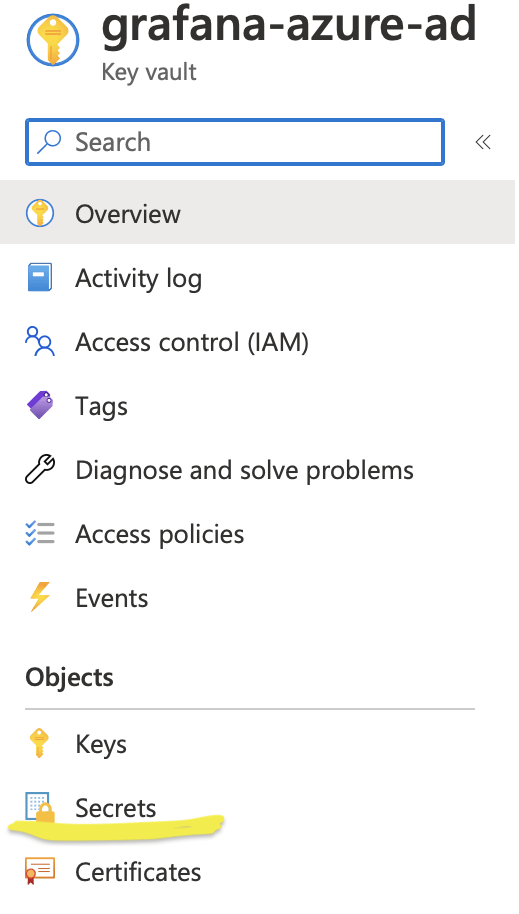
Create a SecretProviderClass for Vault Integration
This is to create a SecretProviderClass named grafana-azure-ad-vault-integration which will allow access AzureKeyVault to fetch client id and client secret for AzureAD.
userAssignedIdentityID can be fetched by running
az aks show -g {{{ fill_in_resource_group_name }}} -n {{{ fill_in_aks_name }}} --query addonProfiles.azureKeyvaultSecretsProvider.identity.clientId -o tsvvault-integration.yaml
kubectl apply -f vault-integration.yaml -n monitoringSample Values file for deployment with Persistent Volumes and integration with AzureAD and KeyVault
loki-stack-values.yaml
prometheus-values.yaml
Deployment
helm upgrade --install loki  grafana/loki-stack -f loki-stack-values.yaml -n monitoring
helm upgrade --install prometheus prometheus-community/prometheus -f prometheus-values.yaml -n monitoring
Create nginx ingress for grafana
This will create an nginx ingress. You need to create k8s secret to install your tls certificate separately to allow https on your grafana url and replace {{{ tls-cert-secret }}} by the created secret name in grafana-ing.yaml.
grafana-ing.yaml
kubectl apply -f grafana-ing.yaml -n monitoringCreate data source for prometheus in grafana
promethus-data-source.yaml
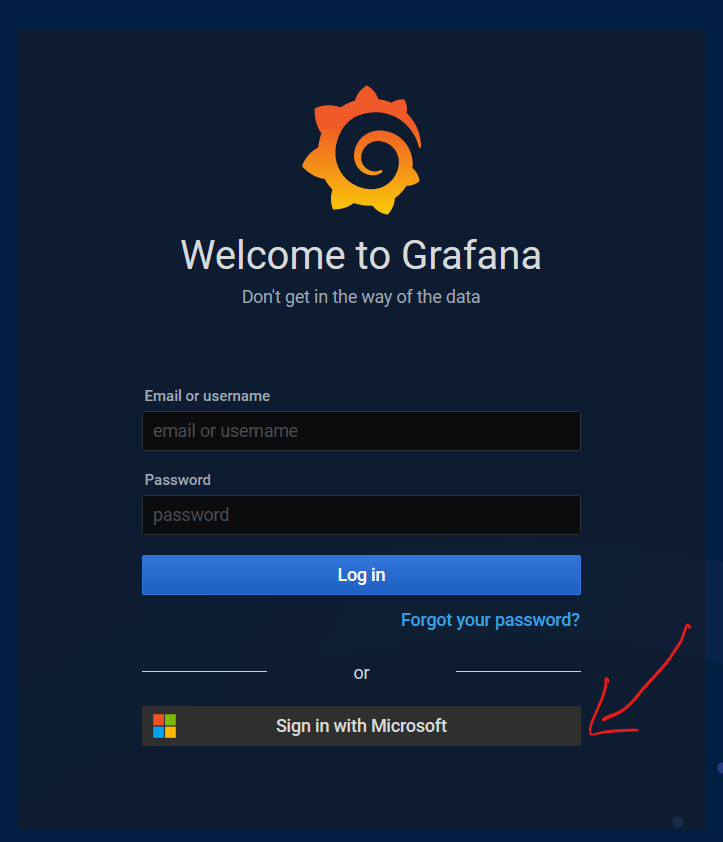
kubectl apply -f promethus-data-source.yaml -n monitoringAfter successful deployment, you would be able to access grafana at your public dns with AzureAD.
Creating Dashboards in Grafana
You can import provided json files for AKS monitoring dashboard and logging dashboard.
aks-dashboard.json
aks-logs.json