


IPL(Indian Premier League) Dashboard using Flask, AmCharts, and MongoDB
Introduction
- IPL as we all know is one of the most decorated cricket premier leagues in the world.
- In this blog, we are going to take the IPL dataset from 2008 to 2020.
- We are going to download that dataset from Kaggle – https://www.kaggle.com/patrickb1912/ipl-complete-dataset-20082020
- We are going to store this dataset in our database, we will be using MongoDB as our database.
- We will be using the Flask framework for our application.
- For creating the visualization charts we will be using AmCharts4.
- For MongoDB references, you can check out – https://statusneo.com/mongodb-introduction/
- Let’s begin creating our IPL visualization application.
Data Cleaning
- In this task, we are going to clean our dataset.
- Once you have downloaded your dataset, you will be able to see 2 files there- IPL Ball-by-Ball 2008-2020.csv, IPL Matches 2008-2020.csv
- For this project, we will work only on the matches dataset.
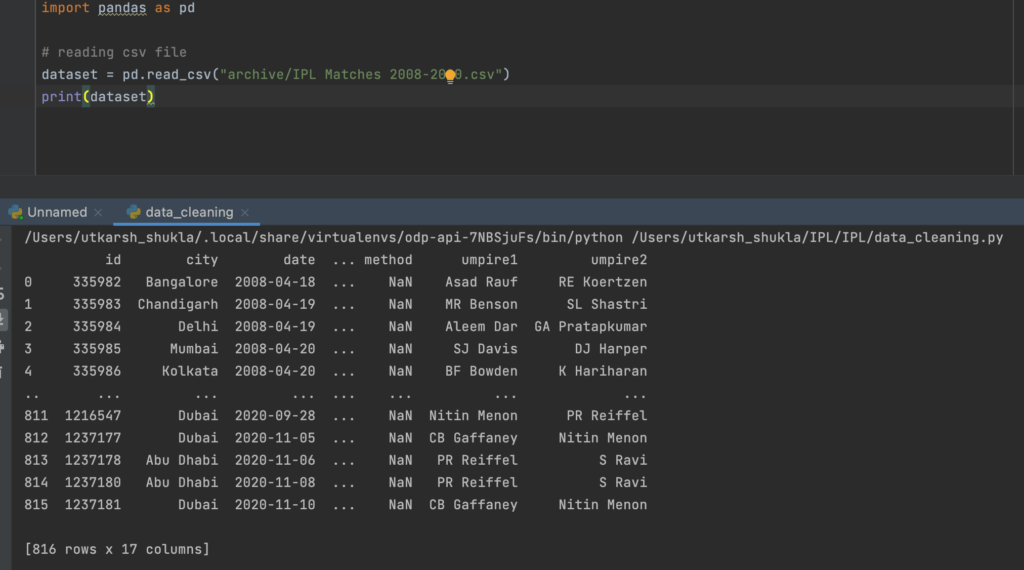
- This is how our dataset look likes.
- So for cleaning purposes let’s first remove the null values from the dataset.
- We will be removing rows having null values in team1 or team2 column.
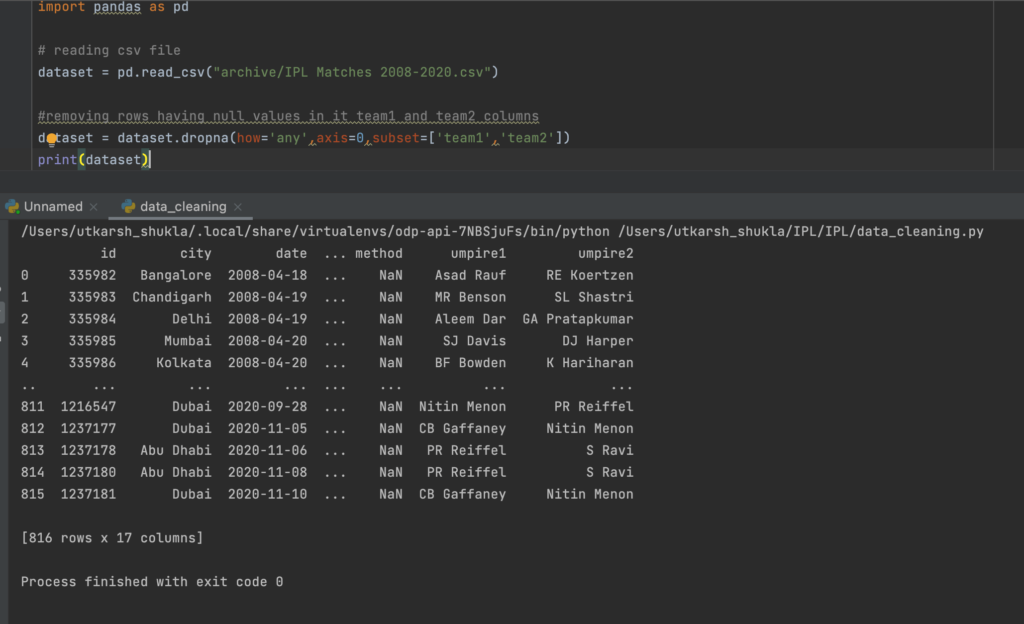
- This is how our dataset looks after cleaning, although no rows are removed because there were no null values present there.
- But I will prefer to do this step as it helps in cleaning the data if there is some Null value present.
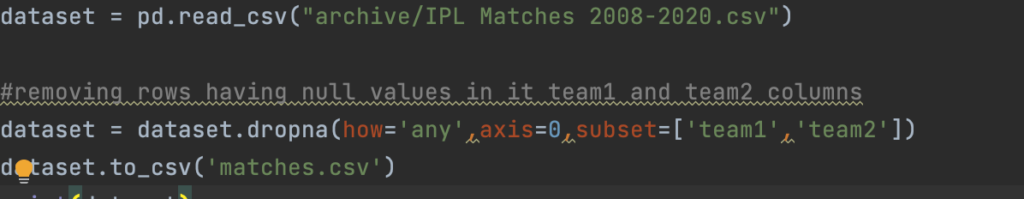
- Let’s create this CSV file to matches.csv and store it in the same directory.
Data Upload to MongoDB Cluster
- MongoDB is going to be our primary database for this project.
- We are going to use MongoDB cloud and the free cluster that they provide.
- For uploading the data we will do it using our python code, with the help of pymongo library.
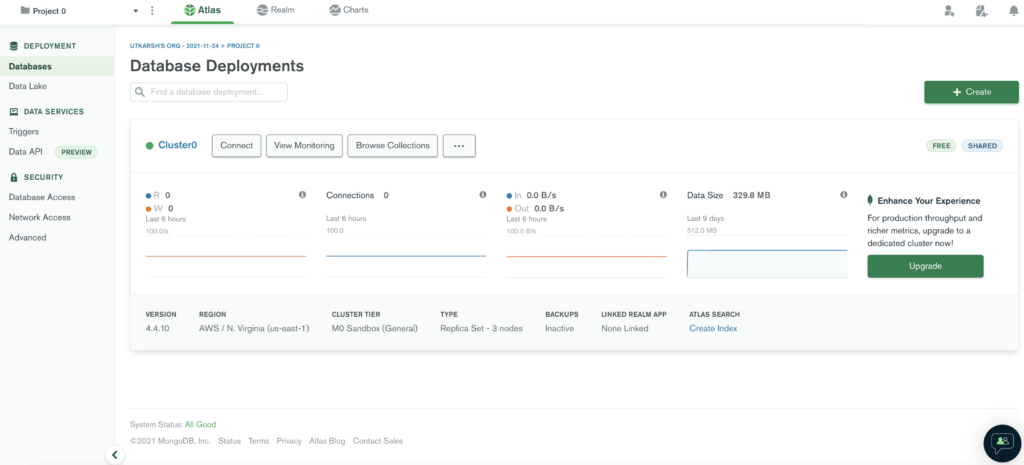
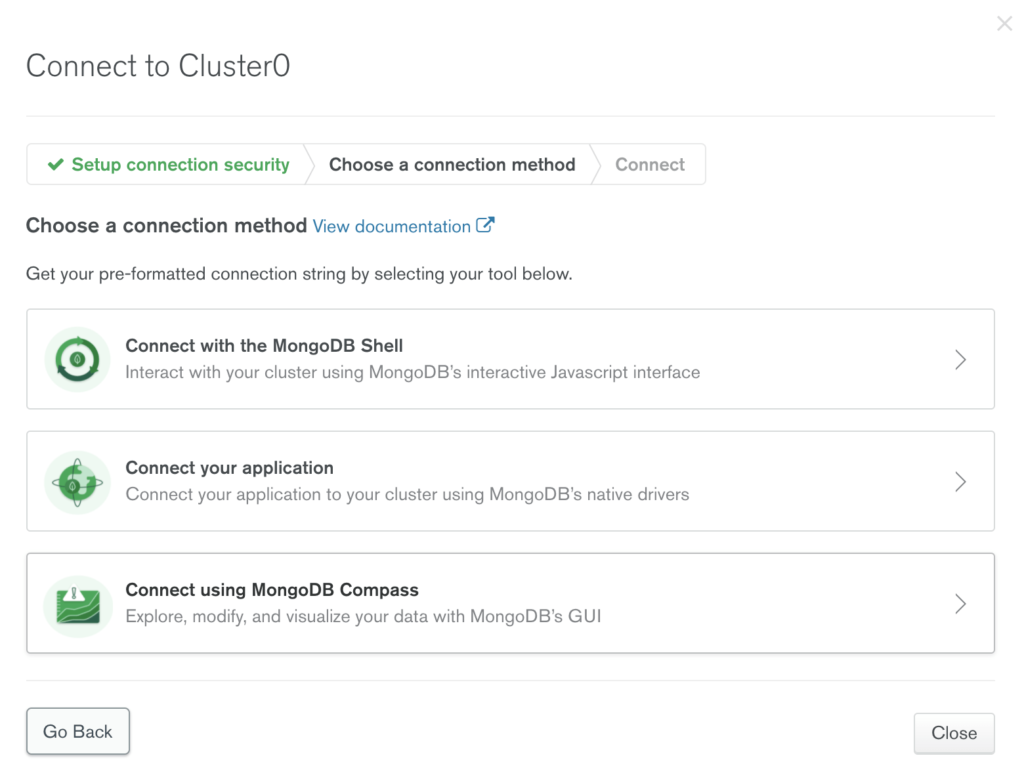
- After creating your account on MongoDB cloud you will be redirected to a window that looks like this.
- For finding the connection string to the cluster you can click on the connect button and select the application to get your link.
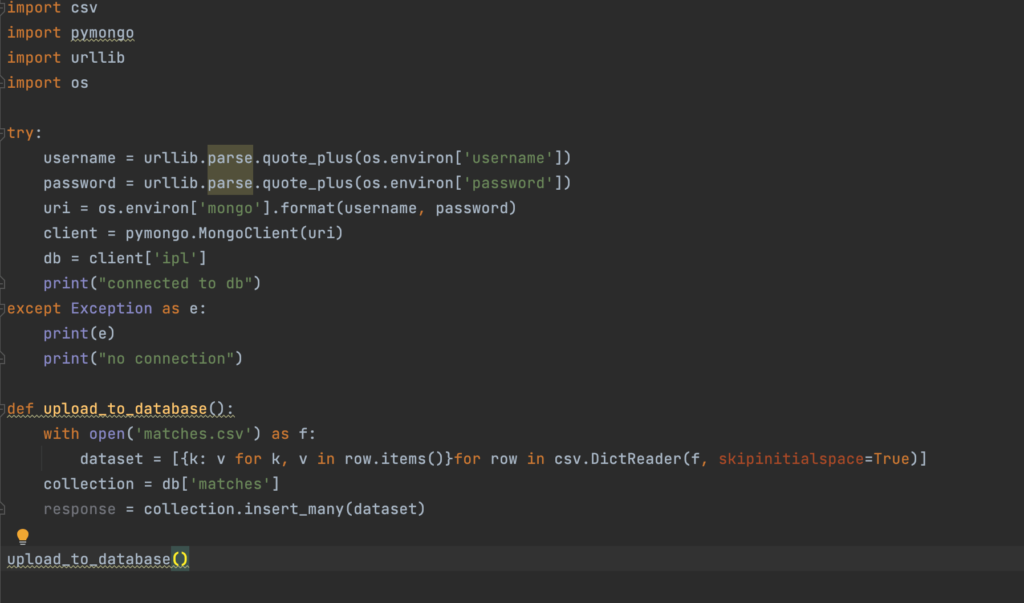
- Code to upload code to the MongoDB cluster is –
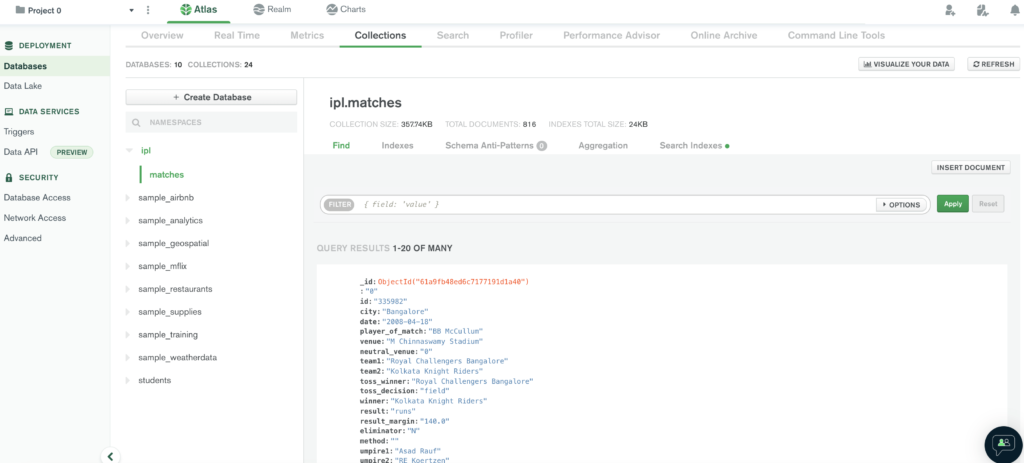
- Let’s see the MongoDB cloud console and see how the data is looking there.
- So now our data has been cleaned and uploaded to the database, let’s begin with the application.
Application Using Flask
- Let’s start creating our flask application.
- We are going to follow the generic structure of creating a flask application.
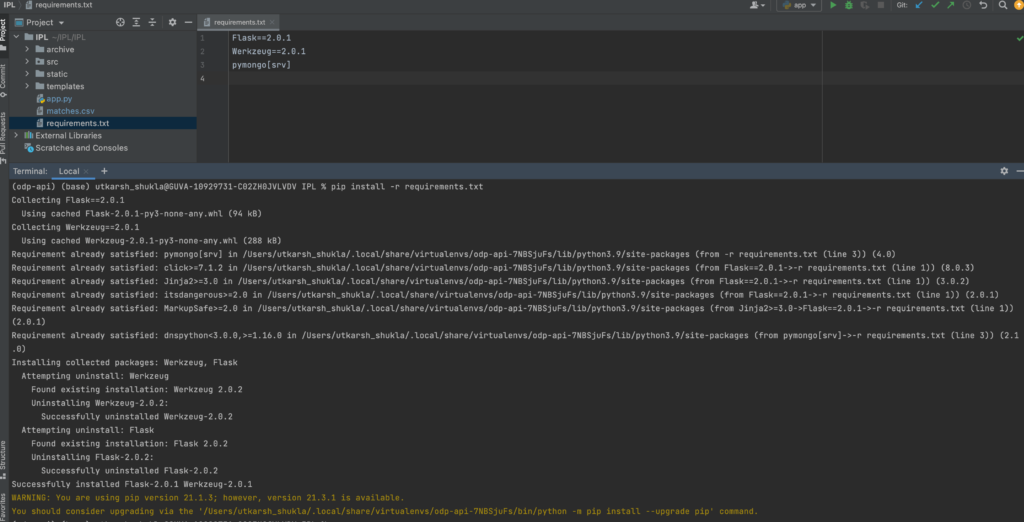
- We will be having a requirement.txt file where all the packages and their versions will be provided.
- Then we will be having an src folder that will be having all the APIs and the backend-related stuff.
- In the templates, we will be having our UI templates.
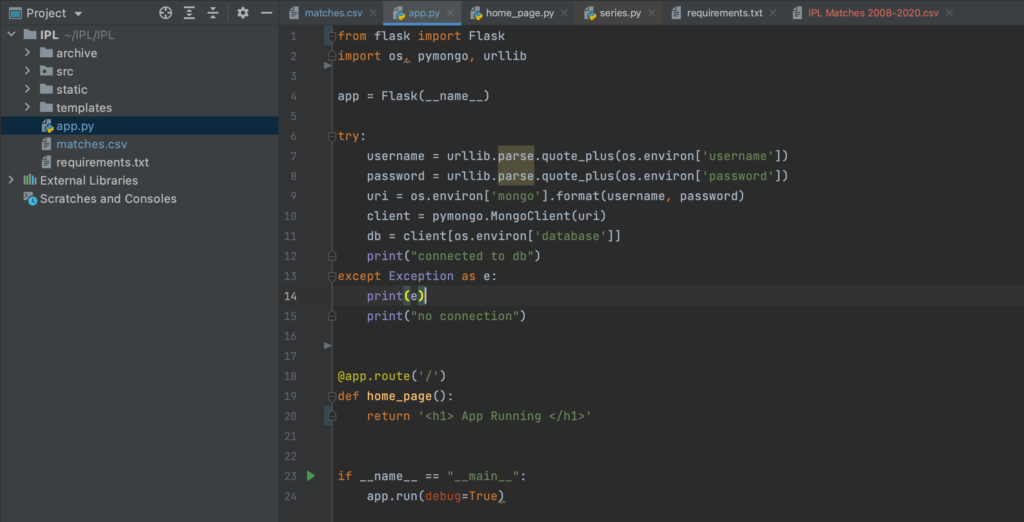
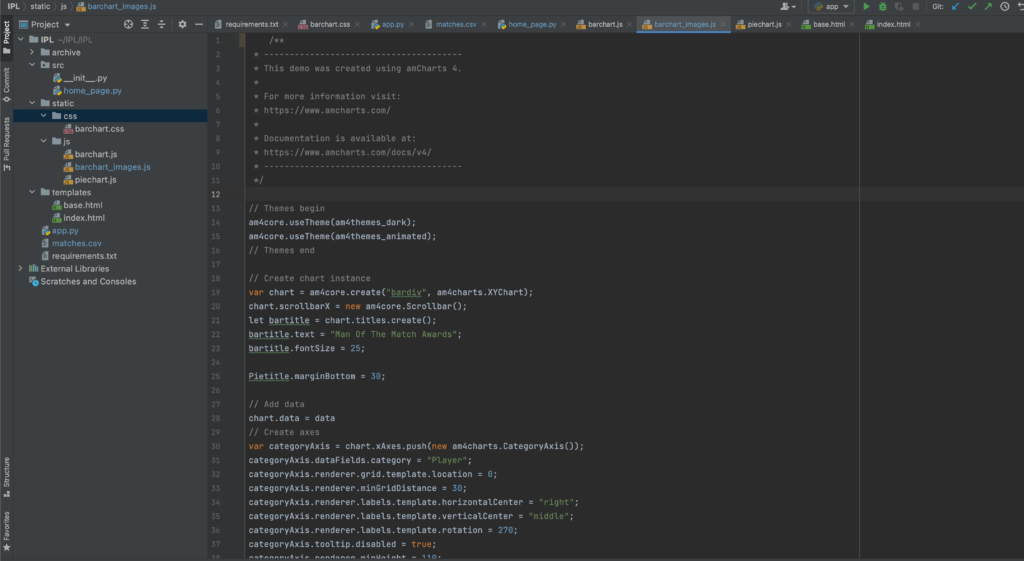
- This is how the structure of our project looks like.
- We need to run pip install -r requirements.txt, it will install all our required packages.
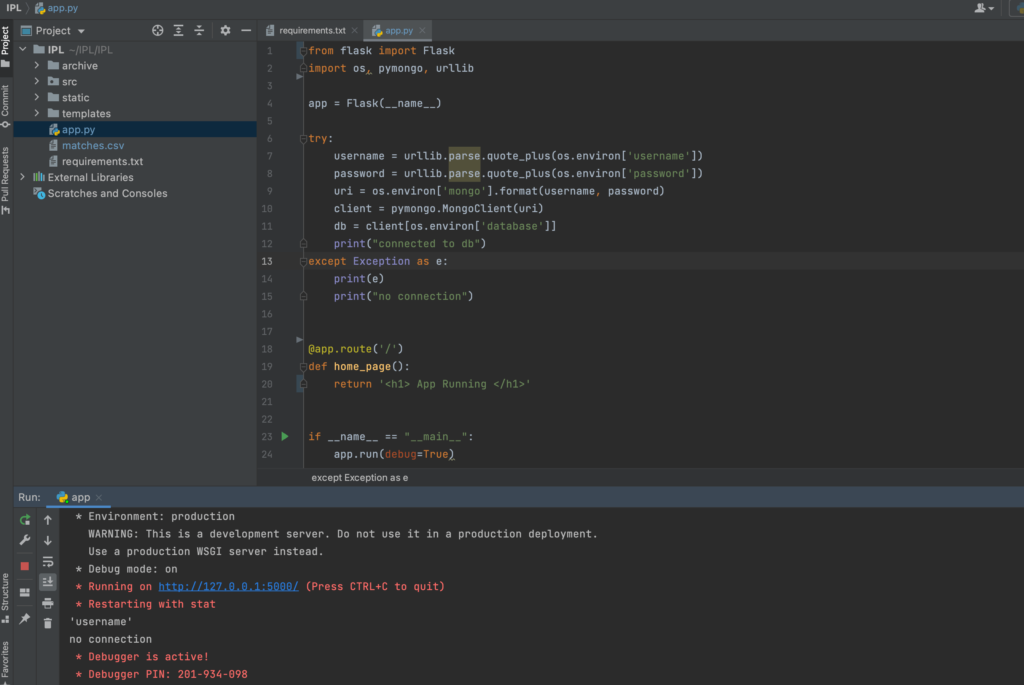
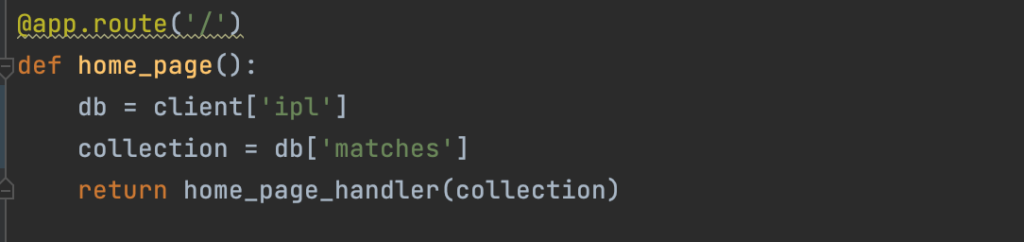
- Lets run our app, by running the app.py file, in this file we created the connection with MongoDB.
- app.route is the URL that will initiate the function, by default the home page will be opened.
- https://www.amcharts.com/docs/v4/ , this is the link to the amcharts4 official documentation that we are going to use in our project.
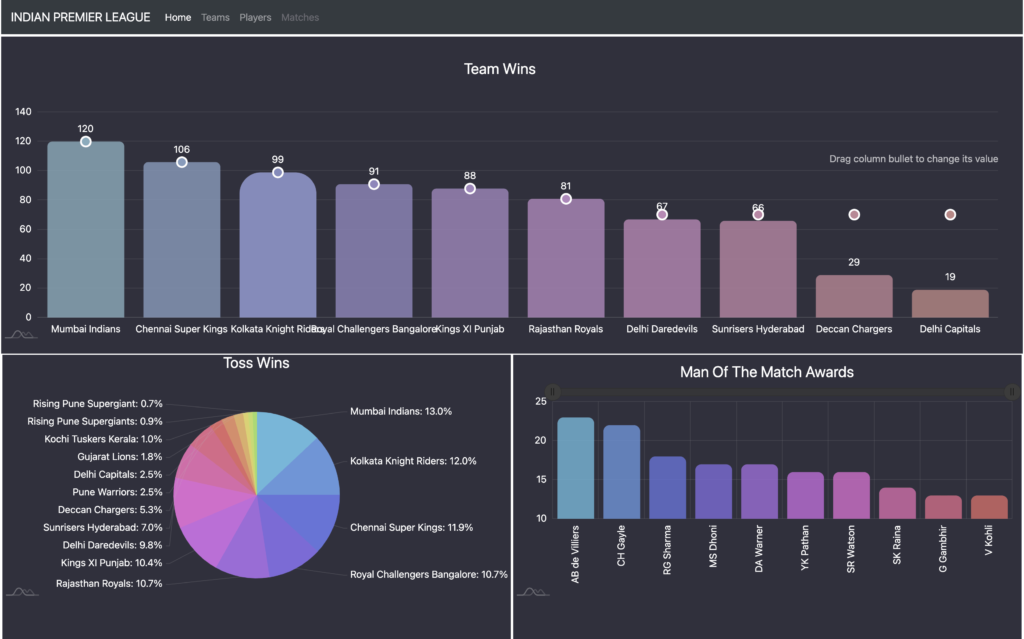
- Let’s create our homepage, so on our homepage, we want to have 3 charts.
- In the first half of our page, we want to show the team’s bar chart with their wins.
- In the second half, we want to show two charts.
- One Pie chart of teams with their toss wins.
- Other charts of players with their man-of-the-match awards.
- Let’s create our home_page file in the src directory.
- And also create an index.html in templates. It’s a dummy template we have taken from the bootstrap official website.
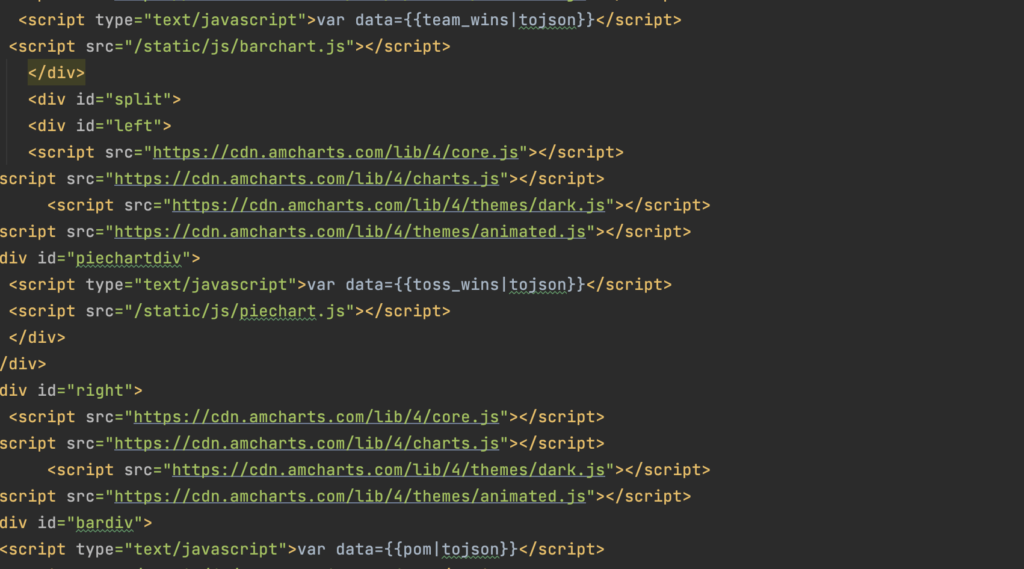
- Let’s have the bar charts and pie chart code from amcharts4 and add it to our js directory under static.
- In our src folder let’s add the code for fetching the data from MongoDB.
- we will be bringing the data for the team wins, toss wins, and player of the match awards.
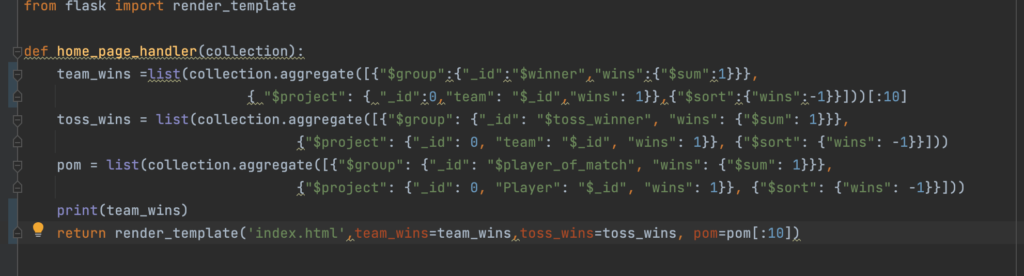
- In the templates, file let’s add the response of our dataset.
- I am not covering all the code, because it will become very long then.
- So I will be sharing my GitHub link to this code.
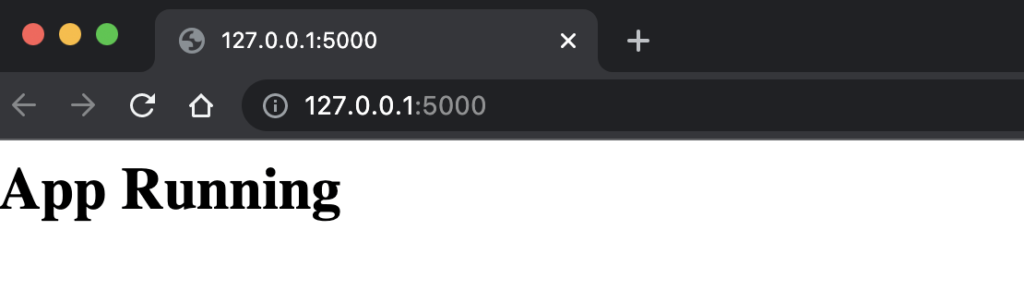
- Now let’s start our application and see what our work looks like..
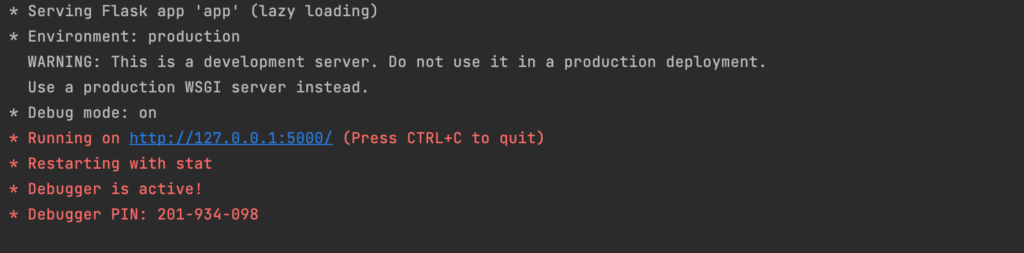
- Now our app is up, so let’s try our home page.
Conclusion
- And here it is, our home dashboard is ready, if you want to have more charts or more data analysis go ahead the stage is set now.
- So we collected the data, cleaned it, uploaded it to our database, created our flask application, used amcharts there, and visualized the dataset.
- The whole application code is available at GitHub at – https://github.com/Utkarsh731/IPL
- For any queries feel free to contact me- at utkarsh.shukla@statusneo.com, https://www.linkedin.com/in/utkarsh-shukla-1520a8255/
- Still Curious? Visit my website to know more!
- For more interesting Blogs Visit- Utkarsh Shukla Author
0 Comments


Add Comment
You must be logged in to post a comment.