K-means clustering is a type of unsupervised machine learning algorithm. It means the model doesn’t get labeled data; all data comes with only input variables, and therefore, we cannot find out the accuracy because we do not have the ground truth value. Working with such data mainly focuses on the clustering of homogeneous data points. As we know, unsupervised machine learning uses clusters of data, whereas supervised machine learning uses individual data.
In the K-means clustering algorithm, the main task is to cluster homogeneous data points. This is a distance-based algorithm since we require scaling before modeling. The K-means clustering algorithm uses the Minkowski metrics principle to measure the distance between data points, following the Euclidean distance parameter, which calculates the distance from point to point. (You can learn more about this in KNN.) Now, the number of clusters that will be created depends on the elbow method.
Let’s understand this with a simple example.
Recently, two major telephone industry giants merged to form one big company, and now all their customers are united. As the company is united, the role of chairpersons has automatically increased to make decisions that can reduce both companies’ losses. For that, they need information in a format that makes it easy to understand the actual conditions and make decisions or focus on implementing new activities in the company. (Because when two companies merge, their objective is to reduce losses and stand out in the market.)
Information like the number of customers from company A and company B need separate groups, and within those groups, there are some other groups required, like the number of people who recharge the big package, those who use it the most, those who use it very little, identifying VIP customers to offer more new plans, offering related plans to regular customers, and bringing back mainstream customers who have been using it very rarely.
If the superiors get information in this way, they will easily take decisions in the interest of the company. For such segmentation, k-means clustering helps, which creates homogeneous clusters.
Now let’s understand how k-means works.
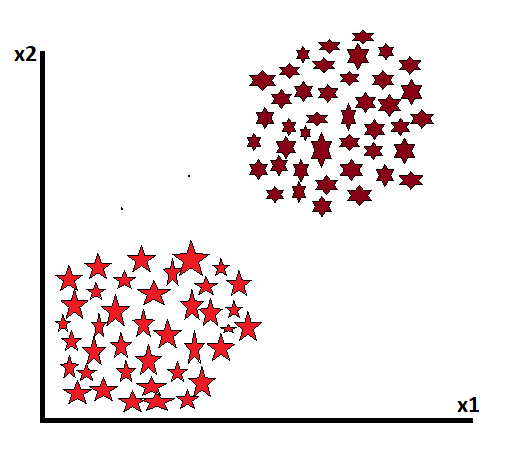
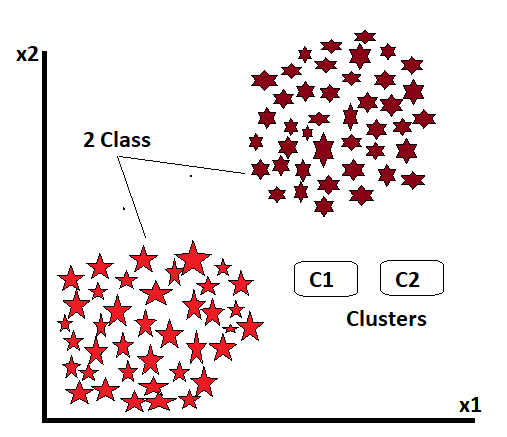
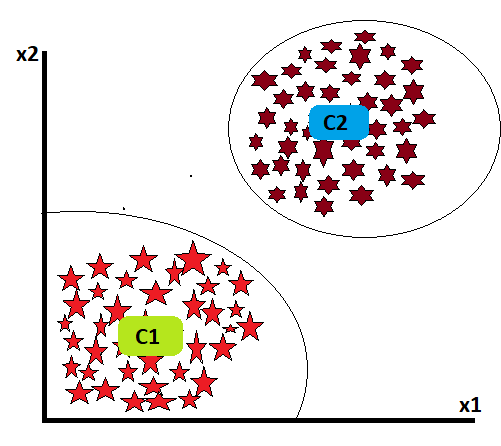
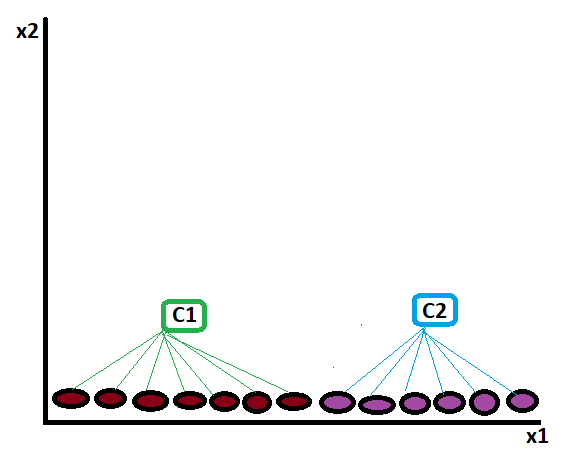
Suppose we have two classes of data, which are not target variables, and we want to divide them into clusters. Now, if we want to see from the beginning, we define the value of k at the beginning. Now that k represents how many classes we want to divide the data into, the number of classes is the k value. Here we have given the value of k as 2, which means we want to divide all this data into two classes.
We use Menkwoski metrics to segment the data, and these metrics use the Euclidean distance measure by default.
d = √((x2 – x1)^2 + (y2 – y1)^2)
.
The value of k means that we are going to make two classes. The value of k is used to determine the centroids. And that’s the centroid’s job: to map the data points near the centroid, find which data points are homogeneous and which are heterogeneous, and create homogeneous data clusters.
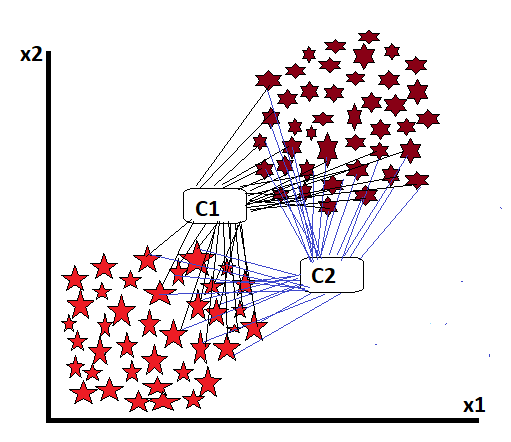
For this, in the first stage, we create centroids according to the number of classes we want to create. These centroids measure the distance between them and each data point. And whoever is close will try to keep them in their class.
But why won’t all this be done in one iteration? Because in the initial stage, the centroid lies randomly in any place, and some similar data points may be missed from its distance, the position of the centroid, which is placed by mistake, is shifted to a new place by doing some mathematical calculations. In this process, some more data points will come close, and the class will start to become stronger.
Now another question arises: how long will this iteration last? The answer is until a steady point is determined, from which the centroid’s position will not change in any iteration at all. Up to that point, the iteration will continue.
————————————————————————————————————————————————————————————————-
Let’s look if we get such data then how K-mean clustering works:
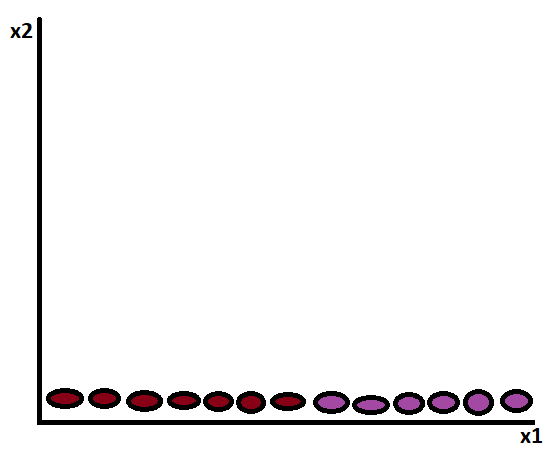
In such above dataset, suppose we assign k=2, then
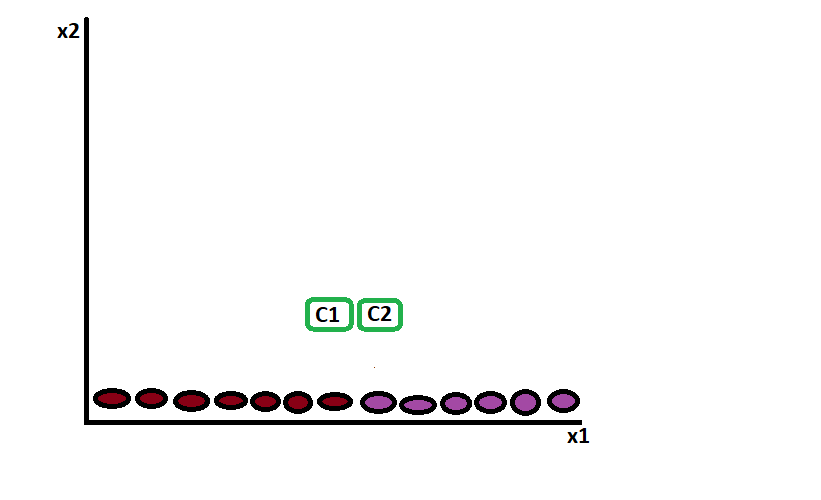
These clusters start to map the distance:
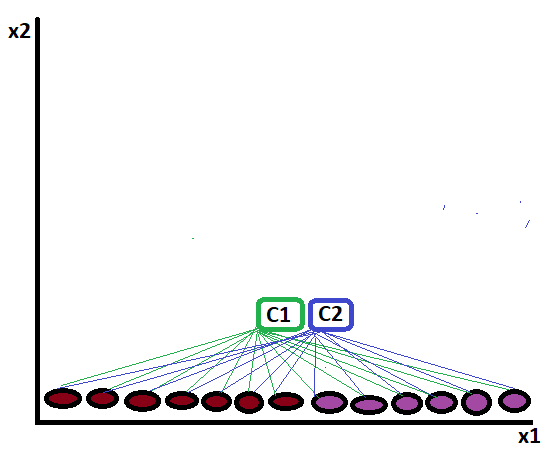
And finalize the cluster like:
————————————————————————————————————————————————————————————————-
Let’s understand it step by step:
| 2 | 3 |
| 3 | 3 |
| 4 | 5 |
| 6 | 7 |
| 7 | 6 |
| 8 | 8 |
| 10 | 7 |
| 11 | 8 |
Dataset:
Initial Centroids:
Centroid 1: (3, 3)
Centroid 2: (9, 7)
centroids (k = 2).
First Iteration
In this iteration, we will assign data points to the nearest centroids and then update the centroids based on the assigned data points.
Assign Clusters
Calculate the Euclidean distance between each data point and the centroids. Assign each data point to the nearest centroid.
Data Point Distance to Centroid 1 Distance to Centroid 2
| x1 | x2 | Distance from Centroid 1 | Distance from Centroid 2 |
| 2 | 3 | 1.414 | 7.071 |
| 3 | 3 | 0.000 | 6.083 |
| 4 | 5 | 2.236 | 5.000 |
| 6 | 7 | 4.243 | 3.162 |
| 7 | 6 | 5.000 | 2.236 |
| 8 | 8 | 6.364 | 2.236 |
| 10 | 7 | 7.810 | 1.4141 |
| 11 | 8 | 8.485 | 2.236 |
Assign data points to clusters based on the minimum distance.
| x1 | x2 | Centroid 1 | Centroid 2 |
| 2 | 3 | 2,3 | |
| 3 | 3 | 3,3 | |
| 4 | 5 | 4,5 | |
| 6 | 7 | 6,7 | |
| 7 | 6 | 7,6 | |
| 8 | 8 | 8,8 | |
| 10 | 7 | 10,7 | |
| 11 | 8 | 11,8 |
Update Centroids
Calculate the mean of each cluster to obtain the new centroids:
New Centroid 1: (3, 3.67) —– (2+3+4)/3 = 3, (3+3+5)/3 = 3.67
New Centroid 2: (8.4, 7.2) —- (6+7+8+10+11)/5 = 8.4, (7+6+8+7+8)/5 = 7.2
—————————————————————————————————————————————————————————————————————————————————
The Second Iteration
In this iteration, we will again assign data points to the nearest centroids and then update the centroids based on the assigned data points.
Assign Clusters
Calculate the Euclidean distance between each data point and the centroids. Assign each data point to the nearest centroid.
Data Point Distance to Centroid 1 Distance to Centroid 2
| x1 | x2 | Distance from Centroid 1 (3,3.67) | Distance from Centroid 2 (8.4, 7..2) |
| 2 | 3 | 0.670 | 7.330 |
| 3 | 3 | 0.670 | 6.541 |
| 4 | 5 | 1.619 | 4.333 |
| 6 | 7 | 3.097 | 1.801 |
| 7 | 6 | 3.197 | 1.202 |
| 8 | 8 | 4.085 | 1.280 |
| 10 | 7 | 6.279 | 1.827 |
| 11 | 8 | 7.193 | 2.440 |
Assign data points to clusters based on the minimum distance.
| x1 | x2 | Centroid 1 | Centroid 2 |
| 2 | 3 | 2,3 | |
| 3 | 3 | 3,3 | |
| 4 | 5 | 4,5 | |
| 6 | 7 | 6,7 | |
| 7 | 6 | 7,6 | |
| 8 | 8 | 8,8 | |
| 10 | 7 | 10,7 | |
| 11 | 8 | 11,8 |
Assign data points to clusters based on the minimum distance.
Cluster 1: [(2, 3), (3, 3), (4, 5)]
Cluster 2: [(6, 7), (7, 6), (8, 8), (10, 7), (11, 8)]
Update Centroids
Calculate the mean of each cluster to obtain the new centroids:
New Centroid 1: (3, 3.67)
New Centroid 2: (8.4, 7.2)
—————————————————————————————————————————————————————————————————————————————————
Third Iteration
In this iteration, we will again assign data points to the nearest centroids and then update the centroids based on the assigned data points.
Assign to Clusters
Calculate the Euclidean distance between each data point and the centroids. Assign each data point to the nearest centroid.
Distance from data points to centroids:
| x1 | x2 | Distance from Centroid 1 (3, 3.67) | Distance from Centroid 2 (8.4, 7.2) |
| 2 | 3 | 0.670 | 7.330 |
| 3 | 3 | 0.670 | 6.541 |
| 4 | 5 | 1.619 | 4.333 |
| 6 | 7 | 3.097 | 1.801 |
| 7 | 6 | 3.197 | 1.202 |
| 8 | 8 | 4.085 | 1.280 |
| 10 | 7 | 6.279 | 1.827 |
| 11 | 8 | 7.139 | 2.440 |
Assign data points to clusters based on the minimum distance.
| x1 | x2 | Centroid 1 | Centroid 2 |
| 2 | 3 | 2,3 | |
| 3 | 3 | 3,3 | |
| 4 | 5 | 4,5 | |
| 6 | 7 | 6,7 | |
| 7 | 6 | 7,6 | |
| 8 | 8 | 8,8 | |
| 10 | 7 | 10,7 | |
| 11 | 8 | 11,8 |
Assign data points to clusters based on the minimum distance.
Cluster 1: [(2, 3), (3, 3), (4, 5)]
Cluster 2: [(6, 7), (7, 6), (8, 8), (10, 7), (11, 8)]
Update Centroids
Calculate the mean of each cluster to obtain the new centroids:
New Centroid 1: (3, 3.67)
New Centroid 2: (8.4, 7.2)
—————————————————————————————————————————————————————————————————————————————————
Fourth Iteration
In this iteration, we will again assign data points to the nearest centroids and then update the centroids based on the assigned data points.
Assign to Clusters
Calculate the Euclidean distance between each data point and the centroids. Assign each data point to the nearest centroid.
Distance from data points to centroids:
| x1 | x2 | Distance from Centroid 1 (3, 3.67) | Distance from Centroid 2 (8.4, 7.2) |
| 2 | 3 | 0.670 | 7.330 |
| 3 | 3 | 0.670 | 6.541 |
| 4 | 5 | 1.619 | 4.333 |
| 6 | 7 | 3.097 | 1.801 |
| 7 | 6 | 3.197 | 1.202 |
| 8 | 8 | 4.085 | 1.280 |
| 10 | 7 | 6.279 | 1.827 |
| 11 | 8 | 7.139 | 2.440 |
Assign data points to clusters based on the minimum distance.
| x1 | x2 | Centroid 1 | Centroid 2 |
| 2 | 3 | 2,3 | |
| 3 | 3 | 3,3 | |
| 4 | 5 | 4,5 | |
| 6 | 7 | 6,7 | |
| 7 | 6 | 7,6 | |
| 8 | 8 | 8,8 | |
| 10 | 7 | 10,7 | |
| 11 | 8 | 11,8 |
Assign data points to clusters based on the minimum distance.
Cluster 1: [(2, 3), (3, 3), (4, 5)]
Cluster 2: [(6, 7), (7, 6), (8, 8), (10, 7), (11, 8)]
Update Centroids
Calculate the mean of each cluster to obtain the new centroids:
New Centroid 1: (3, 3.67)
New Centroid 2: (8.4, 7.2)
—————————————————————————————————————————————————————————————————————————————————
Since the centroids remain unchanged after the fourth iteration, the algorithm has now reached convergence.
Final Result:
The final clusters are as follows:
| Cluster 1 (3,3.67) | Cluster 2 (8.4,7.2) |
| 2,3 | |
| 3,3 | |
| 4,5 | |
| 6,7 | |
| 7,6 | |
| 8,8 | |
| 10,7 | |
| 11,8 |
In this way, the clustering creates homogeneous classes, and now it’s easier to find the class, which up until now was unlabeled. By using this label, we can perform any supervised operation easily.
————————————————————————————————————————————————————————————————-
Now at last: who decides the k value? In the above example, we took 2 as the value of k, but in real life, it doesn’t happen like this. To decide the number of centroids or k value, we use the Elbow method:
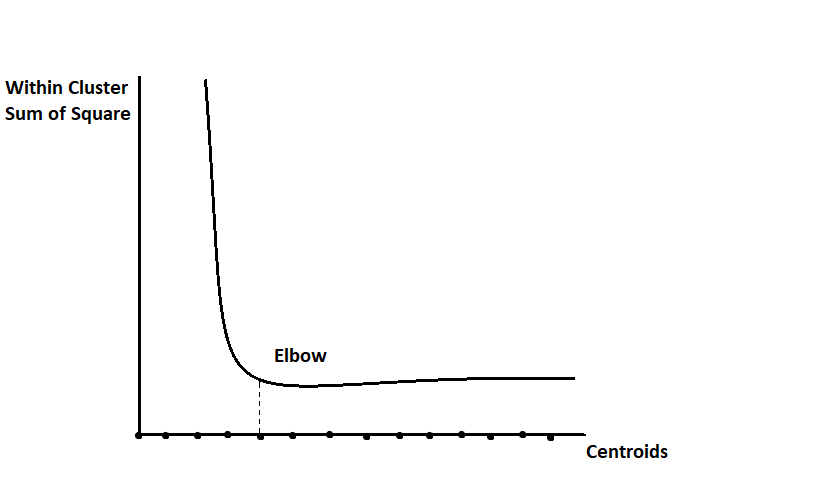
In the above figure, you can see that on the x-axis, there are several of k’s. On the y-axis, values of inertia count within clusters by finding the sum of the squares of data points. That means the ratio of conversions of homogeneous data into appropriate clusters. We can see whether a slight curve is there; that curve’s x-axis value is known as the best prediction for deciding the k’s value.