Cross-validation is a fundamental technique used in machine learning and statistics to assess the performance of a predictive model and mitigate issues related to overfitting. It involves partitioning a dataset into subsets for training and testing purposes. The primary goal of cross-validation is to estimate how well a model will generalize to new, unseen data.
Overfitting:
Overfitting occurs when a machine learning model learns the training data too well, capturing noise and random fluctuations instead of the underlying pattern. As a result, the model performs exceptionally well on the training data but poorly on new, unseen data. Essentially, the model becomes too complex and starts memorizing the training examples rather than generalizing them.
Example of Overfitting:
Imagine you’re trying to predict a student’s performance on an exam based on the number of hours they study. You collect data from various students and plot it on a graph. If you fit a highly complex polynomial curve to the data points, it might touch or closely follow every data point. However, this curve might have numerous twists and turns that don’t reflect the true relationship between studying hours and exam performance. When you apply this model to predict the performance of a new student who wasn’t in your initial dataset, it could give wildly inaccurate predictions due to its overly complex nature.
Underfitting:
Underfitting, on the other hand, underfitting occurs when a model is too simplistic to capture the underlying patterns in the data. It fails to capture the complexities present in the training data and thus performs poorly not only on the training data but also on new data. An underfit model is often characterized by having high bias and low variance.
Example of Underfitting:
Continuing with the student performance prediction example, imagine you use a linear regression line to model the relationship between studying hours and exam performance. If the data points are scattered all over the graph and the line doesn’t fit them well, your model might be underfitting. It oversimplifies the relationship and fails to account for the fact that sometimes, increased studying might lead to better performance, but there are other factors at play as well.
Balanced Fit:
The goal of machine learning is to find the right balance between these two extremes. A balanced fit, also known as a well-generalizing model, captures the essential patterns in the data without getting bogged down by noise or oversimplification. It leads to good performance on both the training and new, unseen data.
Example of Balanced Fit:
In our student performance prediction example, a balanced fit could be achieved by using a quadratic curve to capture the underlying trend between studying hours and exam performance. This curve would align well with the general shape of the data points while not trying to fit every single one perfectly. When applied to predict the performance of a new student, this model would provide more accurate estimates compared to the overfit and underfit scenarios.
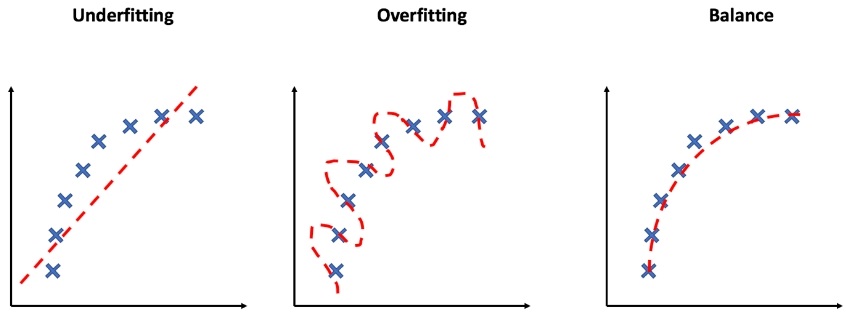
Overfitting occurs when a model is too complex and fits noise in the data, while underfitting happens when a model is too simplistic and fails to capture the data’s complexities. A balanced fit aims to find the sweet spot that captures the underlying patterns without succumbing to noise or oversimplification. But it doesn’t happen, so to avoid overfitting issues, we use cross-validation.
Cross-validation is an essential tool for model evaluation, helping to assess a model’s performance more reliably and accurately than a simple train-test split. By providing a comprehensive assessment of generalization performance, it guides model selection and parameter tuning decisions, ultimately contributing to more robust and effective machine learning models.
Advantages of Cross-Validation:
- Reduced Bias: Cross-validation reduces the bias that might result from using a single train-test split, as each data point is used in both training and testing.
- Better Model Assessment: It provides a more robust estimate of the model’s performance by evaluating it on multiple validation sets.
- Data Efficiency: Cross-validation maximizes data usage, as all data points are used for both training and testing at some point.
- Parameter Tuning: It aids in hyperparameter tuning by allowing you to assess how different parameter choices affect model performance across multiple iterations.
Here’s a breakdown of how cross-validation works:
Data Splitting:
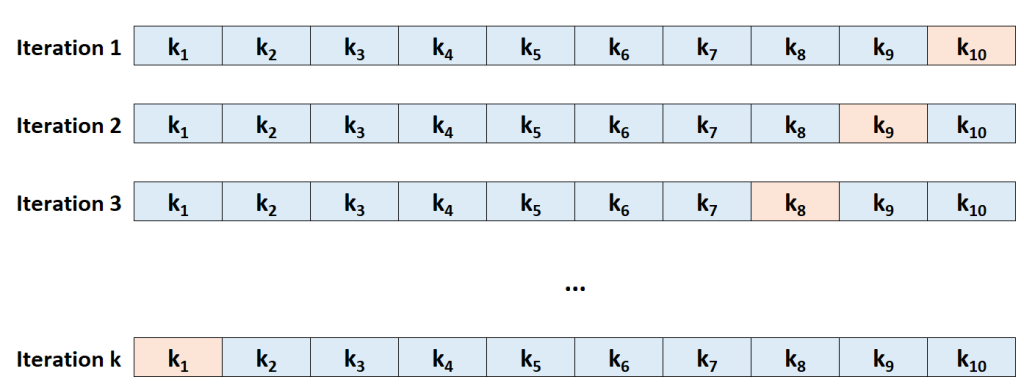
In cross-validation, the dataset is divided into multiple subsets or “folds.” The most common approach is k-fold cross-validation, where the data is split into ‘k’ equal parts.
Model Training and Testing:
The process starts with training and testing the model ‘k’ times. In each iteration, one fold is used for testing, while the remaining ‘k-1’ folds are used for training. This way, the model is trained on different subsets and tested on different parts of the data.
Performance Metric Calculation:
After each iteration, the performance metric (such as accuracy, precision, recall, etc.) of the model is recorded based on its performance on the test fold. These metrics are then averaged over the ‘k’ iterations to provide an overall performance assessment.
Final Performance Estimation:
The final performance estimation of the model is typically calculated as the average of the performance metrics obtained in each iteration.
Let’s go through deeply:
1. Data Splitting:
Imagine you have a dataset containing information about houses and their prices. To assess your model effectively, you can’t just test it on the same data it learned from; that would be like asking a student questions from their textbook. Instead, you divide your dataset into multiple subsets or “folds.” The most common approach is k-fold cross-validation.
Let’s say you choose 5-fold cross-validation. Your dataset is divided into 5 equal parts or folds. Each fold contains a diverse sample of your data.
2. Model Training and Testing:
Now, the training and testing process begins. Think of your model as a student preparing for an exam. In each (round) iteration of cross-validation:
One fold is set aside as the test set.
The remaining ‘k-1’ folds are used as the training set.
The student (your model) studies using the training set, learning the patterns and relationships present in the data. It’s like the student using a set of textbooks to understand different topics.
3. Performance Metric Calculation:
After studying (model training) with the training set, the student (model) faces a test (model testing) with the test set. The student answers questions (makes predictions) based on what they’ve learned.
In the context of your machine learning model, you compare its predictions on the test set with the actual values (ground truth). This comparison is done using performance metrics such as accuracy, precision, recall, or others, depending on the problem. These metrics tell you how well the model performed on this specific fold.
4. Final Performance Estimation:
Now, here comes the beauty of cross-validation. The process of training and testing is repeated ‘k’ times, each time with a different fold held out as the test set. This ensures that every data point gets a chance to be in the test set at least once.
After all ‘k’ rounds, you have ‘k’ performance metric values. To get an overall sense of how well your student (model) is doing, you take the average of these metrics. This average provides you with an estimate of your model’s performance on unseen data.
This estimation is crucial for understanding whether your model is overfitting (memorizing the training data) or underfitting (not capturing the data’s patterns). If the average performance is consistently good across all ‘k’ rounds, you can have more confidence in your model’s ability to generalize to new, real-world situations.
Cross-validation is like an educational journey for your model, where it learns from different textbooks (training sets) and faces various exams (test sets). The grades (performance metrics) it gets help you understand its overall capabilities, making sure it’s well-prepared to tackle real-world challenges.
Example of Cross-Validation:
Let’s consider a simple example of using 5-fold cross-validation to evaluate the performance of a machine learning model for classifying handwritten digits into numbers 0 to 9. The dataset contains 1000 images.
Data Splitting: The dataset is divided into 5 equal folds, each containing 200 images.
Iteration 1: Fold 1 is used as the test set, and Folds 2 to 5 are used for training. The model is trained on Folds 2 to 5 and tested on Fold 1.
Iteration 2: Fold 2 becomes the test set, and Folds 1, 3, 4, and 5 form the training set. The model is trained on Folds 1, 3, 4, and 5 and tested on Fold 2.
Iteration 3: This time, Fold 3 is the test set, and Folds 1, 2, 4, and 5 are combined for training.
Iteration 4: Fold 4 serves as the test set, and Folds 1, 2, 3, and 5 are used for training.
Iteration 5: Finally, Fold 5 acts as the test set, and Folds 1, 2, 3, and 4 are used for training.
After these iterations, the performance metrics (e.g., accuracy) obtained from each fold’s testing phase are averaged to yield the model’s overall performance estimate. This process provides a more reliable indication of how well the model will generalize to new, unseen data compared to a single train-test split.
Types of Cross-Validation techniques:
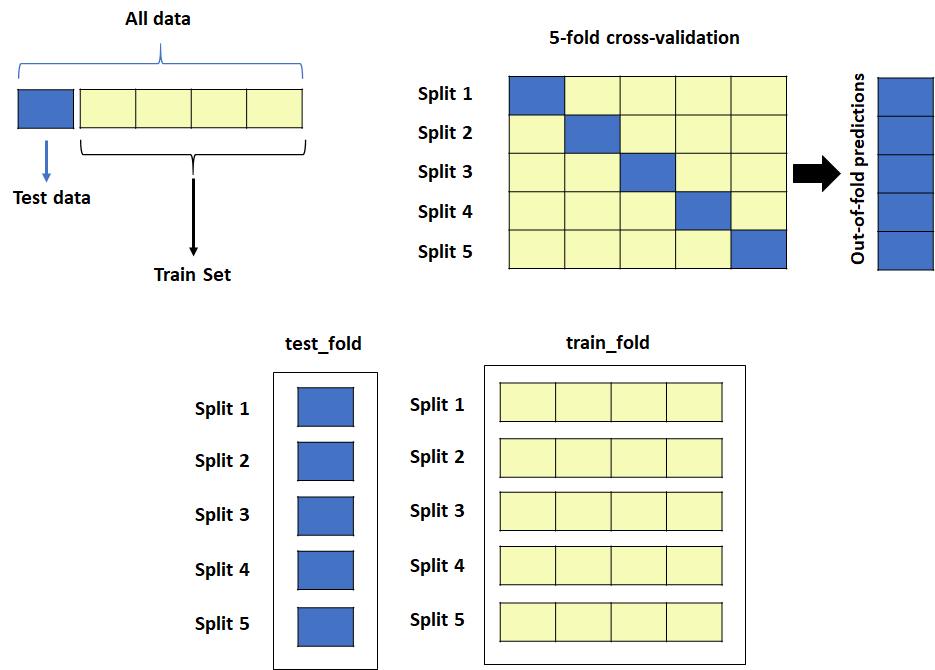
K-Fold Cross-Validation:
- In this method, the dataset is divided into ‘k’ equally sized folds.
- The model is trained and evaluated ‘k’ times, each time using a different fold as the validation set and the remaining folds as the training set.
- The final performance metric is the average of the performance metrics from all ‘k’ rounds.
- K-fold cross-validation helps in getting a robust estimate of a model’s performance.
In k-fold cross-validation, you split your dataset into ‘k’ equal parts or folds. The model is trained ‘k’ times, with each fold taking turns as the validation set while the remaining folds form the training set. This helps to get a better understanding of your model’s performance across different subsets of the data.
Example:
Consider you’re building a spam email classifier. You have 1000 emails, and you choose 5-fold cross-validation. You divide the emails into 5 groups of 200 each. You train your model 5 times, using a different group as the validation set each time while the other groups are the training set.
Advantages:
- Provides a robust estimate of model performance.
- All data points are used for both training and validation.
- Helps in reducing the impact of randomness in a single train-test split.
Disadvantages:
- Computationally more intensive as it requires training the model ‘k’ times.
- Might not work well if the data has a specific temporal order or patterns.
Stratified K-Fold Cross-Validation:
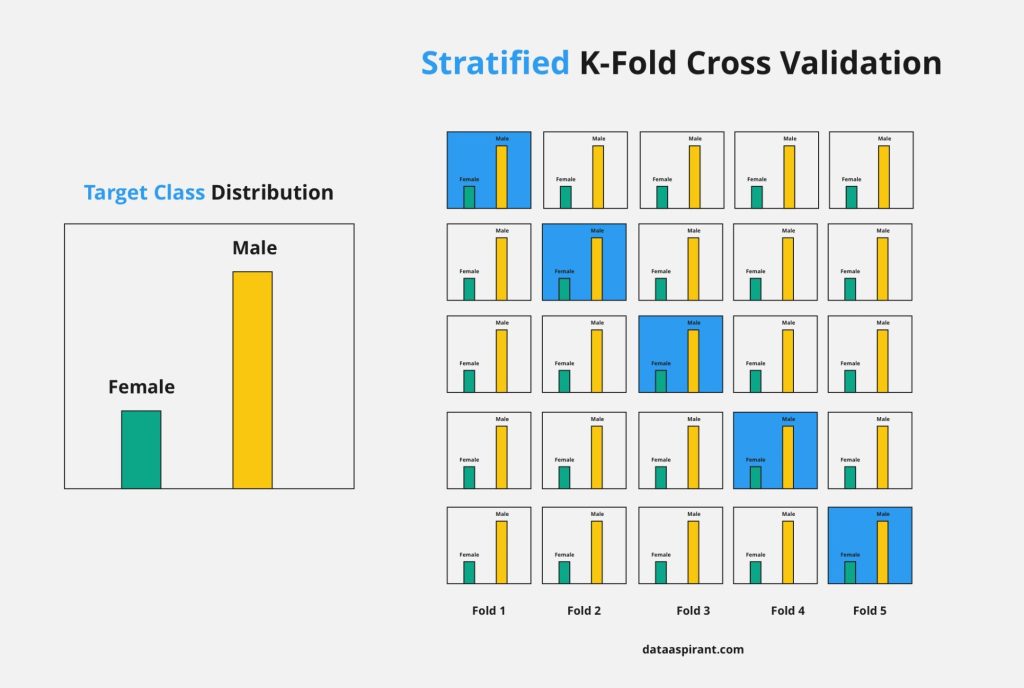
- This variation of k-fold cross-validation ensures that each fold maintains the same class distribution as the original dataset.
- It’s especially useful for datasets with imbalanced classes, preventing one fold from having significantly more or fewer instances of a particular class.
Stratified k-fold is an enhancement of the basic k-fold method. It ensures that each fold maintains the same class distribution as the original dataset. This is especially useful when dealing with imbalanced datasets.
Example:
Continuing with the spam email classifier, if 90% of your emails are non-spam and 10% are spam, stratified k-fold ensures that each fold has the same ratio of spam to non-spam emails as the original dataset.
Advantages:
- Works well with imbalanced datasets.
- Provides a more representative estimate of model performance on different classes.
Disadvantages:
- Can be computationally more demanding, especially with large datasets.
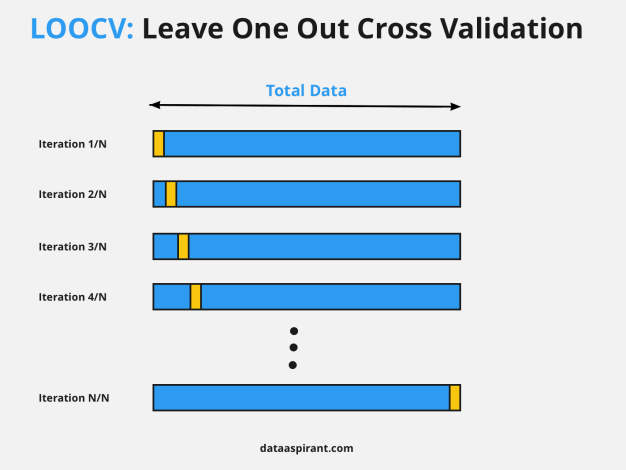
Leave-One-Out Cross-Validation (LOOCV):
- LOOCV takes the concept of k-fold cross-validation to the extreme by using one data point as the test set and the remaining points as the training set in each iteration.
- It provides an unbiased estimate of a model’s performance but can be computationally expensive for large datasets.
LOOCV takes extreme cross-validation by using only one data point as the validation set in each iteration. This method provides an unbiased estimate but can be computationally expensive for large datasets.
Example:
Imagine you’re trying to predict house prices based on features. For LOOCV, you’d use a single house’s data as the validation set while training on the rest.
Advantages:
- an unbiased estimate of model performance.
- Uses all data points for both training and validation.
Disadvantages:
- Extremely computationally intensive for large datasets.
- This might lead to high variance in the performance estimate due to the small size of validation sets.
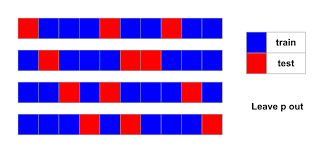
Leave-P-Out Cross-Validation (LPOCV):
- Similar to LOOCV, but instead of leaving one instance, you leave ‘p’ instances out as the test set in each iteration.
- LPOCV strikes a balance between LOOCV and k-fold cross-validation, providing a good trade-off between computational cost and performance estimation accuracy.
LPOCV is a generalization of LOOCV where ‘p’ data points are left out as the validation set in each iteration. It aims to strike a balance between LOOCV and k-fold cross-validation.
Example:
If you choose ‘p’ as 5 in LPOCV, you leave out 5 houses’ data for validation while training on the rest.
Advantages:
- Less computationally intensive than LOOCV.
- Provides a balance between the bias of LOOCV and the variance of k-fold CV.
Disadvantages:
- Still more computationally demanding than k-fold cross-validation.
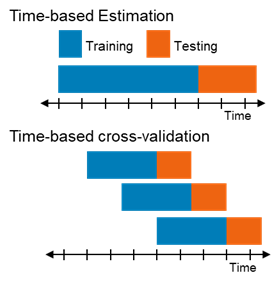
Time Series Cross-Validation:
- This is used when dealing with time-dependent data, where the order of data points matters.
- In time series cross-validation, earlier data is used for training, and later data is used for testing, mimicking the real-world scenario where predictions are made on future data.
Time series cross-validation is used when dealing with time-dependent data. It respects the temporal order of the data while splitting it into training and validation sets.
Example:
Suppose you’re predicting stock prices. You’d use earlier stock price data for training and later data for validation, just as you would in real-world scenarios.
Advantages:
- Takes into account the temporal order of data, which is crucial for time-dependent patterns.
Disadvantages:
- Can’t be used for non-time-dependent data.
Nested Cross-Validation:
- This method involves a combination of two cross-validation loops: an outer loop and an inner loop.
- The outer loop splits the data into training and testing sets as usual.
- The inner loop is used to select hyperparameters or perform model selection within each training set from the outer loop.
- Nested cross-validation is useful for obtaining more reliable estimates of a model’s performance and generalization.
Nested cross-validation combines two cross-validation loops: an outer loop for model evaluation and an inner loop for hyperparameter tuning or model selection.
Example:
In the outer loop, you use k-fold cross-validation to assess your model. Within each outer fold, you perform another round of k-fold cross-validation to fine-tune hyperparameters.
Advantages:
- Provides a more reliable performance estimate by considering both model selection and performance assessment.
- Helps in reducing the impact of randomness.
Disadvantages:
- Increased computational complexity due to the nested structure.
Repeated K-Fold Cross-Validation:
- This approach involves repeating k-fold cross-validation multiple times with different random partitions of the data.
- It provides a more stable performance estimate by averaging results across multiple random splits.
Repeated k-fold cross-validation involves performing k-fold cross-validation multiple times with different random partitions of the data. It aims to provide a more stable performance estimate.
Example:
You might repeat 5-fold cross-validation 10 times, each time shuffling the data differently before splitting.
Advantages:
- Reduces the impact of randomness by averaging over multiple runs.
- Provides a more robust estimate of model performance.
Disadvantages:
- Requires more computational resources due to repeated runs.
- Each type of cross-validation has its strengths and weaknesses. The choice depends on factors like dataset size, data distribution, computational resources, and the specific goals of your analysis. By selecting the appropriate type of cross-validation, you ensure a reliable assessment of your model’s performance and its ability to generalize to new data.