Supercharging DevOps with DORA Metrics in Backstage
The ability to quickly and reliably deliver software is crucial in the fast-paced software development world. DevOps practices have become essential for organisations striving to improve their software delivery performance. To measure and enhance these practices, DORA (DevOps Research and Assessment) metrics provide invaluable insights. Integrating these metrics into Backstage, an open platform for building developer portals, allows teams to gain real-time visibility into their DevOps performance, leading to improved efficiency and effectiveness.
Understanding DORA Metrics
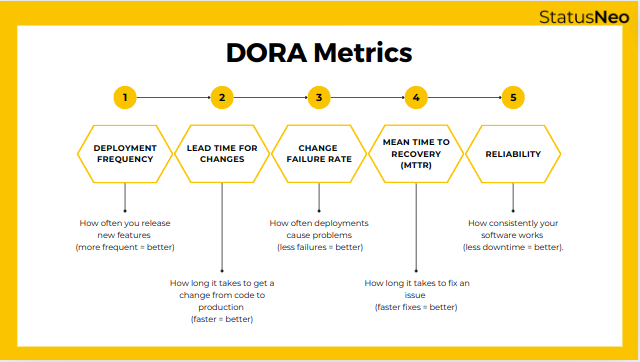
Leveraging data from over 32,000 professionals and seven years of research, the DevOps research division of Google Cloud Platform, known as the DORA team, has identified five key metrics for DevOps. These DORA metrics help pinpoint the most efficient ways to deliver software and measure the effectiveness of CI/CD pipelines. By utilising these metrics, organisations can classify their teams as Elite, High, Medium, or Low performers and adjust operations to boost productivity and service deliverables. Let’s dive into each metric to discover what they can reveal about DevOps teams.

Deployment Frequency
Deployment Frequency (DF) measures how often code changes are deployed to production. This can vary widely depending on legal restrictions or the necessity for updates, ranging from multiple times a day to once per year. For example, mobile apps that require users to update to the latest version typically release 4-6 updates per year. In contrast, a SaaS solution can deploy changes multiple times a day. DF provides insight into how quickly an organisation can deliver new features, bug fixes, and improvements to users.
Lead Time for Change
Lead Time for Change (LTFC) measures the velocity of software delivery by identifying the time needed to release an update after the code is deployed to production. A shorter LTFC indicates greater efficiency in deploying code changes to production. This metric not only measures the implementation time for changes but also reflects how responsive the DevOps team is in meeting user demands. It helps organisations gauge their agility in delivering new features and enhancements promptly.
Mean Time to Recovery
Mean time to recovery (MTTR) is one of the most efficient DORA software metrics that identify the average amount of time between a bug report and the moment the bug is fixed. This metric enables organisations to evaluate software stability and team agility in the face of a challenge. In today’s fast-paced world, this DORA metric for DevOps is essential for businesses as they can’t afford grave errors in production for a longer period.
Change Failure Rate
Change Failure Rate (CFR) is a crucial metric that measures the percentage of deployments to production that result in severe errors, rollbacks, or any type of production failure requiring immediate attention. Tracking CFR over time provides valuable insights into the effectiveness of deployments and the stability of production environments. By understanding CFR, organisations can allocate resources more efficiently, prioritise improvements in deployment processes, and enhance overall software reliability.
Reliability
In 2021, the DORA team introduced a new metric, “Reliability,” aimed at helping DevOps teams meet software reliability targets. Broadly, this metric evaluates how well an organization meets user expectations regarding availability, latency, scalability, and performance.
Unlike other DORA metrics, Reliability does not have predefined categories like low, medium, high, or elite. Its interpretation varies significantly based on service-level indicators or objectives (SLIs/SLOs) specific to each organisation.
These DORA metrics for DevOps provide invaluable insights into software development effectiveness, delivery pipeline performance, and the overall efficiency of DevOps teams globally. By leveraging these metrics, organisations can optimise their processes and enhance the reliability of their software products.
Implementing DORA Metrics in Backstage
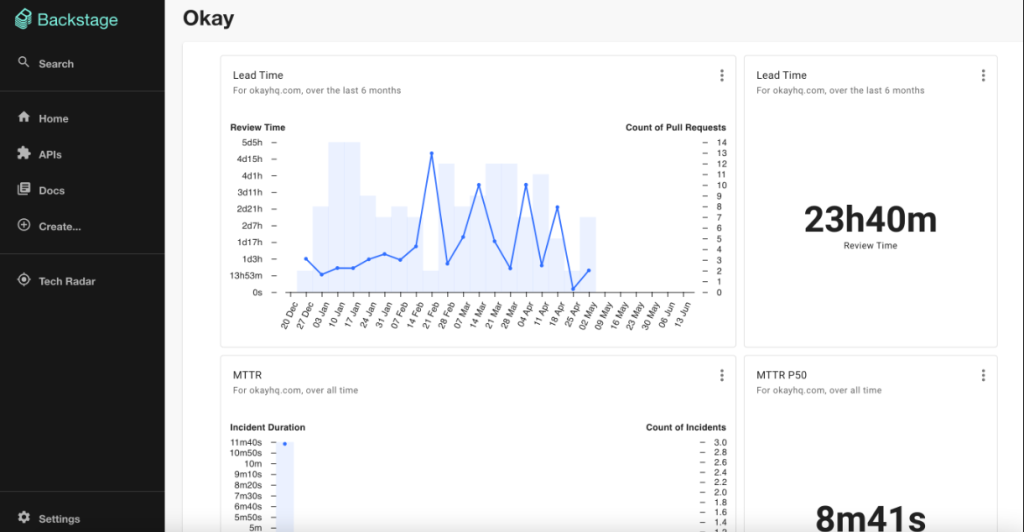
Integrating DORA metrics into Backstage allows teams to visualize and track their performance in real-time. There are two primary ways to include DORA metrics in Backstage:
Using an Open-Source DORA Metrics Plugin
This involves installing and configuring an existing DORA metrics plugin available in the open-source community.
Creating a Custom DORA Metrics Plugin
For more tailored needs, teams can develop their own custom DORA metrics plugin, adapting it to specific data sources and visualization requirements.
Here’s how to set it up:
Step 1: Setting Up Backstage
Ensure you have Backstage set up in your environment. You can follow the official Backstage documentation for installation and setup.
Step 2: Installing the DORA Metrics Plugin
If you’re using an open-source plugin, install it into your Backstage app by adding the plugin to your Backstage configuration and dependencies. For custom plugins, start by setting up the plugin framework in Backstage.
Step 3: Configuring Data Sources
Configure your data sources, such as CI/CD pipelines and monitoring tools, to feed data into the DORA metrics plugin. This typically involves setting up API connections and ensuring the necessary data is available.
Step 4: Creating Dashboards and Visualizations
Use Backstage’s dashboard capabilities to create visualizations of your DORA metrics. Customize the dashboards to display Deployment Frequency, Lead Time for Changes, MTTR (Mean Time to Recovery), Change Failure Rate, and Reliability in a way that provides actionable insights for your team.

Real-World Impact of DORA Metrics in Backstage
Tracking DORA metrics in Backstage has significantly improved our DevOps processes. By continuously monitoring these metrics, we have been able to:
- Identify Bottlenecks: We identified bottlenecks in our delivery pipeline and took corrective actions to streamline workflows.
- Reduce Lead Time for Changes: Faster feature delivery was achieved by reducing the lead time for changes.
- Improve Incident Response Times: Enhanced incident response times led to a lower Mean Time to Recovery (MTTR).
- Decrease Change Failure Rate: The stability of our releases improved by decreasing our change failure rate.
- Ensure High Reliability: We maintained consistent service availability and reduced disruptions, ensuring high reliability.
Benefits of Using DORA Metrics in Backstage
Integrating DORA metrics into Backstage offers several benefits:
- Improved Visibility: Real-time dashboards provide transparency across teams, making it easier to track and understand performance metrics.
- Data-Driven Decisions: Teams can use data to make informed decisions, driving continuous improvement in their DevOps practices.
- Enhanced Collaboration: With centralized metrics, teams can collaborate more effectively, identifying and addressing issues together.
- Faster Issue Resolution: Quick access to metrics like MTTR (Mean Time to Recovery) enables faster identification and resolution of problems, minimizing downtime.
- High Reliability: Consistent monitoring ensures that services remain available and stable, enhancing user satisfaction.
Challenges and Best Practices
Implementing DORA metrics can come with challenges, such as ensuring accurate data collection and maintaining the relevance of metrics. Here are some best practices:
- Accurate Measurement: Ensure that your data sources are correctly configured and consistently provide accurate data.
- Regular Reviews: Regularly review and analyze your metrics to identify trends and areas for improvement.
- Team Involvement: Involve your team in the monitoring and analysis process to foster a culture of continuous improvement.
- Iterative Improvements: Use the insights gained from your metrics to make iterative improvements to your DevOps practices.
By adhering to these best practices, organizations can overcome challenges and fully leverage the benefits of DORA metrics in Backstage.
Conclusion
DORA metrics are crucial for measuring and enhancing DevOps performance. By integrating these metrics into Backstage, you can gain real-time visibility into your software delivery processes, driving continuous improvement. The benefits include improved visibility through real-time dashboards, enabling better tracking and understanding of performance metrics. Data-driven decisions become easier as teams use accurate metrics to make informed choices, promoting continuous enhancement of DevOps practices. Enhanced collaboration is facilitated by centralised metrics, allowing teams to work together more effectively. Faster issue resolution is achieved with quick access to metrics like Mean Time to Recovery (MTTR), reducing downtime. High reliability is maintained through consistent monitoring, ensuring services remain available and stable, ultimately enhancing user satisfaction.
Link to my previous Backstage Blog


