

Data Warehouse a New Business Machine
In today’s digital world, data is the backbone of smart decision-making. Businesses that harness data effectively can unlock new opportunities, improve efficiency, and drive growth. But how do they do it? This is where Business Intelligence (BI) and Data Warehousing come into play.
This blog explores how data warehouses work, discusses about their benefits, key components, and modern trends, helping businesses make the most of their data.
Integration of Business Intelligence (BI) with Data Warehouses
The integration of Business Intelligence (BI) with Data Warehouses is one of the most effective strategies for companies to enhance their data management, decision-making, and operational efficiency. Let’s break this into three sections:
1) Overview and Benefits
2) Survey Data
3) Growth Impact and Visualization
1) Overview and Benefits
Data Warehouse is a centralized system that stores large volumes of structured data. It allows businesses to gather and consolidate data from various sources such as sales, marketing, customer relations, finance, etc., to perform analysis. BI tools, on the other hand, are used to analyze this data to extract actionable insights through dashboards, reports, and visualizations.
By integrating BI with a Data Warehouse, companies can achieve:
a) Better Decision-Making: Real-time and historical data analysis allows for more informed decisions.
b) Increased Efficiency: BI tools help identify inefficiencies and areas for improvement.
c) Data-Driven Culture: Employees at all levels have access to valuable insights, encouraging data-driven decision-making across the organization.
d) Competitive Advantage: The ability to quickly adapt to changing market conditions by analyzing data more effectively.
2) Survey Data
Here’s a sample survey data outline, representing how businesses have benefited from integrating BI and Data Warehouses:
| Company Size | Industry | BI Integration Status | Data Warehouse Use | Key Benefits Achieved |
| Small | Retail | Partial | Yes | 15% increase in sales |
| Medium | Manufacturing | Full | Yes | 20% reduction in costs |
| Large | Finance | Full | Yes | 30% faster decision-making |
| Medium | Healthcare | Partial | Yes | 10% reduction in patient wait times |
| Large | E-commerce | Full | Yes | 25% increase in customer satisfaction |
Key Takeaways:
Companies using BI tools with a Data Warehouse typically experience improved sales, cost reductions, faster decision-making, and enhanced customer satisfaction.
Medium-sized companies benefit from an average of 20% efficiency improvement, whereas large companies see even higher impacts.
3) Growth Impact
Integrating BI with a Data Warehouse provides measurable growth in the following ways:
a) Revenue Growth: Data-driven decisions lead to better targeting, increased sales, and improved customer retention. Average revenue growth can increase by 15-30%.
b) Cost Reduction: Automated reporting and data analysis identify inefficiencies and areas for cost-saving. Cost savings can range from 10-25% based on the company’s size.
c) Time Savings: BI tools can automate many manual tasks, allowing employees to focus on higher-value tasks. This can result in productivity boosts ranging from 10-20%.
d) Impact on Different Types of Companies:
i) Retailers: BI helps with inventory management, customer segmentation, and demand forecasting, leading to increased sales and reduced inventory costs.
ii) Manufacturers: Cost optimization, production scheduling, and quality control improvements.
iii) Healthcare Providers: Improved patient care, operational efficiency, and cost management through better data analysis.
iv) Finance & Banking: Risk management, fraud detection, and better decision-making in investments.
v) E-commerce: Real-time analysis of customer behavior helps in personalized marketing and customer experience improvements.
Visualization
To illustrate how BI and Data Warehouses can impact business growth, we can visualize the following data in a bar chart format.
Here’s a basic breakdown of growth impact:
a) Revenue Increase:
i) Small businesses: 10-15%
ii) Medium businesses: 15-20%
iii) Large businesses: 20-30%
b) Cost Reduction:
i) Small businesses: 5-10%
ii) Medium businesses: 10-15%
iii) Large businesses: 15-25%
Here is a bar chart visualizing the impact of BI and Data Warehouse integration across different business sizes. The chart shows the average percentage increase in revenue and cost reduction:
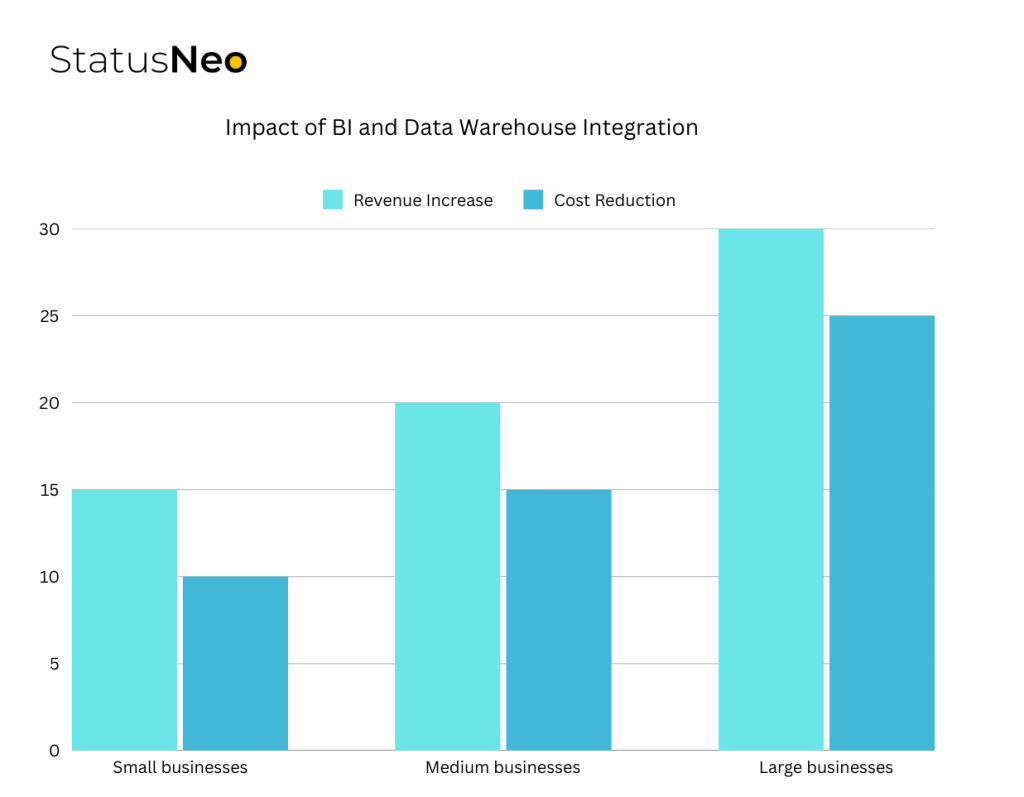
Small businesses see a 15% increase in revenue and 10% reduction in costs.
Medium businesses experience a 20% revenue growth and 15% cost reduction.
Large businesses have the highest impact, with a 30% increase in revenue and a 25% reduction in costs.
This data highlights how companies of different sizes can benefit from adopting Business Intelligence integrated with Data Warehouses. The larger the company, the greater the potential for growth and cost optimization.
Why Do Businesses Need Data Warehouses?
1) Challenges Without a Data Warehouse:
- Companies use multiple databases, making data scattered and difficult to analyze.
- Raw data is unstructured and lacks consistency.
- Real-time business decisions require a single source of truth.
2) How a Data Warehouse Solves These Issues:
- Consolidates data from multiple sources.
- Cleans and organizes data for accuracy.
- Enhances reporting and visualization, making insights more accessible.
A Data Warehouse ensures businesses can access accurate, timely, and meaningful data whenever needed.
Step-by-Step Process:
How Does Data Warehousing Work?
- Extracting Data – Retrieving information from operational databases.
- Transforming Data – Cleaning, integrating, and restructuring it for consistency.
- Loading Data – Storing the refined data in the warehouse.
- Analyzing Data – Using OLAP tools to generate insights.
- Presenting Data – Visualizing findings through dashboards and reports.
Once data is stored in a warehouse, it remains unchanged—any updates occur in the original operational databases before being reloaded.
Core Components of Data Warehousing
1) Data Sources (Input Layer)
- Operational Systems (ERP, CRM, HR databases)
- Flat Files (CSV, JSON, XML)
- Cloud Storage (AWS S3, Google Cloud)
- IoT & Streaming Data (Kafka, MQTT)
2) Data Processing & ETL (Integration Layer)
- ETL (Extract, Transform, Load) tools process data for consistency.
- Metadata Repository maintains transformation rules.
- Staging Area temporarily holds raw data before processing.
3) Storage & Organization (Data Warehouse Layer)
- Data is structured using schema models:
- Star Schema – Simplifies querying with fact and dimension tables.
- Snowflake Schema – Reduces redundancy through normalization.
- Partitioning & Indexing improve query performance.
- Data Marts store department-specific datasets.
4) Analytics & Visualization (Presentation Layer)
- OLAP enables multi-dimensional analysis.
- BI Tools (Tableau, Power BI) support reporting.
- SQL Query Engines (Presto, Redshift) provide access to stored data.
- AI & Data Science Tools (Python, R, Spark) facilitate advanced analytics.
OLAP vs. OLTP: Understanding the Differences
| Feature | OLAP (Analytical Processing) | OLTP (Transactional Processing) |
| Data Type | Historical, aggregated | Current, real-time |
| Purpose | Business insights & reporting | Daily operations & transactions |
| Database Size | Large (100GB – 1TB) | Small (100MB – 1GB) |
| Query Type | Complex queries & analytics | Fast transactions & updates |
| Example | Analyzing financial trends | Processing a bank transaction |
What is ETL?
ETL stands for Extract, Transform, Load and plays a crucial role in data warehousing:
- Extract – Gathers data from various sources.
- Transform – Cleans, organizes, and standardizes the data.
- Load – Moves the structured data into the warehouse for analysis.
ETL ensures that data is accurate, consistent, and ready for business use.
Data Mart
What is a data mart? Is it similar to Data Warehouse?
Data Mart is described as a smaller version of the Data Warehouse, as it focuses on only 1 subject. Hence, they draw data from limited number of
sources. Time taken to build Data Mart is less than time taken to build Data Warehouse.
Data Warehouse vs. Data Mart
Now, let’s look at the differences between the Data Warehouse & Data Mart
| Feature | Data Warehouse | Data Mart |
| Scope | Company-wide data | Department-specific data |
| Subjects | Multiple business areas | A single focus area (e.g., sales, HR) |
| Data Sources | Many sources | Limited sources |
| Size & Complexity | Large, complex | Smaller, easier to manage |
| Implementation Time | Long-term investment | Faster to set up |
Types of Data Marts:
- Dependent Data Mart – Pulls data from a centralized warehouse.
- Independent Data Mart – Gathers data directly from operational sources.
- Hybrid Data Mart – Combines both approaches for flexibility.
The Future of Data Warehousing
1) Cloud-Based Data Warehouses
- Platforms like AWS Redshift, Google BigQuery, and Snowflake offer scalable, pay-as-you-go solutions.
- Supports real-time data processing and large-scale analytics.
2) Real-Time Data Processing
- Technologies like Apache Kafka & Flink enable immediate insights.
- Helps businesses to adapt quickly to market changes.
3) AI-Driven Data Warehousing
Machine learning automates data integration, anomaly detection, and predictive analytics.
4) Decentralized Data Warehousing (Data Mesh)
- Empowers different teams to own and manage their data domains.
- Breaks traditional silos for a more agile, scalable approach.
Final Thoughts
Data Warehousing is a powerful asset for businesses, enabling faster decision-making, improved efficiency, and deeper vision. By integrating BI, ETL, OLAP, and cloud technologies, organizations can stay ahead of the competition.